I want to create a series of plot markers which are circles, squares etc. with 2-3 letter codes centered within the marker. My current attempt looks like this:
{
t4dot =  Graphics[{Green, Disk[{0, 0}, ImageScaled[0.07]],
          Style[Text["T4"], Yellow, Bold, 18]}],
gk1dot = Graphics[{Red, Rectangle[{0, 0}],
          Style[Text["Gk1", {0.5, 0.5}], Yellow, Bold, 14]}]
}
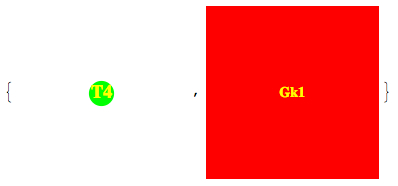
which makes:

The "T4" marker is about right (although the centering is an issue). Obviously, I haven't been able to get rectangle[] to scale properly. When I tried to use these graphics as plot markers the circle and rectangle were huge and swamped the graph whilst the text stayed the same size.
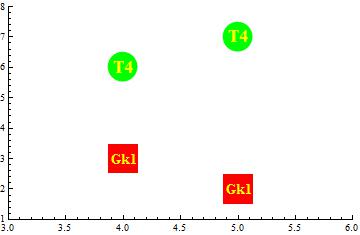
I am aiming to make markers for which the graphics primitive and the text are nicely centered and scale as a group. I want to be able to call the resulting graphics with something like:
ListPlot[{{5, 7}, {4, 6}}, PlotMarkers -> {{t4dot, 16}, {gk1dot, 18}},
  PlotRange -> {{3, 6}, {3, 8}}, ImagePadding -> 35]
Any ideas about how to achieve this?
Also, I have looked here and here and I noticed that Mathematica often offsets the text towards the top-left corner of the graphic. Is there a way to overcome this?


Framed[]to make a square around it (it would be nice to be able make diamonds as well!). $\endgroup$Frameddoes not do too bad, but perhaps you can come up with a really bad example... $\endgroup$