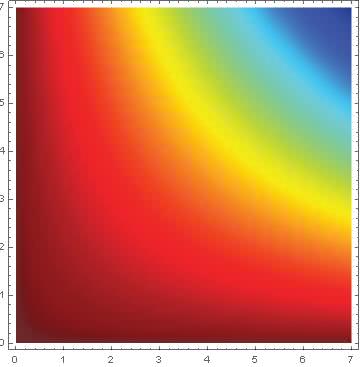
I would like to plot a figure using this kind of colorfunction in Mathematica. I opened the "Color Schemes" from the Palettes menu, but did not find a proper colorfunction.
1 Answer
$\begingroup$
$\endgroup$
3
Here I've extracted a long thin part of your image to get the colours. Then I use the value provided by default ColorFunctionScaling from 0 (blue) to 1 (red), to extract the nearest colour or clip to the colours at the endpoints:
(* get the image and smooth it out to reduce the banding effects *)
img = GaussianFilter[Import["https://i.sstatic.net/fJlC6.png"],11];

(* Take a slice of the image from top to bottom, ignoring black and white parts, then reverse *)
colours = Reverse[ImageData[ImageTake[img, {105, -185}, {100, 120}]][[All, 1]]];

(* scaled from 0 (-50) to 1 (0) *)
scale = Length[colours];
(* select the part of the list near scaled up 'v' and clip to ends if necessary *)
mycf[v_] := RGBColor@colours[[Round[Clip[v*scale, {1, Length[colours]}]]]]

DensityPlot[-x y, {x, 0, 7}, {y, 0, 7}, ColorFunction -> mycf, PlotPoints -> 40]
-
$\begingroup$ Hi, flinty, thank you for your solutions. Now I just updated this post. Could you have time to look at my new questions? $\endgroup$– Mr.2023Commented Jul 10, 2020 at 0:54
-
$\begingroup$ @C.E. ok.sorry I did not know this. I just post a new question. $\endgroup$– Mr.2023Commented Jul 10, 2020 at 6:25
-
$\begingroup$ @flinty Hi, flinty, can you help me for my new question? Thank you. mathematica.stackexchange.com/questions/225646/… $\endgroup$– Mr.2023Commented Jul 10, 2020 at 6:26


