3
$\begingroup$

Consider an implicit function like f

dist[x_, y_] = Sqrt[(x - #1)^2. + (y - #2)^2.] &
f[x_, y_] = dist[-1, 0][x, y] dist[1, 0][x, y]

How to sample points on f[x,y]==c without explicitly solving for y?


f[x,y]==c is a Cassini oval and looks like

Animate[ContourPlot[f[x, y] == t, {x, -3, 3}, {y, -3, 3}, PlotPoints -> 100], {t, 0.6, 2, 0.1}]

fig1. <code>f[x,y]==c</code> for various c

$\endgroup$
4
  • 2
    $\begingroup$ How to sample points on But ContourPlot always did that. So you can just read the samples? t = 1; p = ContourPlot[f[x, y] == t, {x, -3, 3}, {y, -3, 3}]; p[[1,1,1]] gives you the (x,y) data. I also do not understand why you do not want to solve for y explicitly as function of x and then do the sampling? $\endgroup$
    – Nasser
    Commented Apr 17, 2020 at 10:28
  • $\begingroup$ Do you mean sample at equal distances ? $\endgroup$
    – andre314
    Commented Apr 17, 2020 at 10:30
  • $\begingroup$ @andre314 any which way but say uniformly $\endgroup$
    – lineage
    Commented Apr 17, 2020 at 10:34
  • $\begingroup$ @Nasser after solving one has to restructure the different values for the same x and then put them together etc-there's some post proc. involved. Extracting from contour plot was what i was looking for....if you post i'll accept $\endgroup$
    – lineage
    Commented Apr 17, 2020 at 10:39

4 Answers 4

6
$\begingroup$

The sampling is done by ContourPlot. To extract the data:

dist[x_, y_] = Sqrt[(x - #1)^2 + (y - #2)^2] &;
f[x_, y_] = dist[-1, 0][x, y] dist[1, 0][x, y];
t = 1;
p = ContourPlot[f[x, y] == t, {x, -3, 3}, {y, -3, 3}];
p[[1, 1, 1]]

This gives the {x,y} data

You can change the spacing by changing the PlotPoints

 p = ContourPlot[f[x, y] == t, {x, -3, 3}, {y, -3, 3}, PlotPoints -> 5];
 p[[1, 1, 1]]

Mathematica graphics

Also Contours option could be used to control this.

$\endgroup$
4
$\begingroup$

How to sample points on f[x, y] == c without explicitly solving for y?

In old versions of Mathematica, Nasser's method is what I would have used. Nowadays, I would use the MeshFunctions option of ContourPlot[] for the purpose. Observe the following (and note also my rewrite of your implicit Cartesian equation for the Cassinian ovals):

With[{t = 8/9}, (* you can omit the MeshStyle setting if desired *)
     ContourPlot[Product[EuclideanDistance[{x, y}, p], {p, {{-1, 0}, {1, 0}}}] == t,
                 {x, -3, 3}, {y, -3, 3}, Mesh -> {20, 1}, 
                 MeshFunctions -> {#1 &, #2 &}, MeshStyle -> ColorData[97, 4]]

points on Cassinian oval

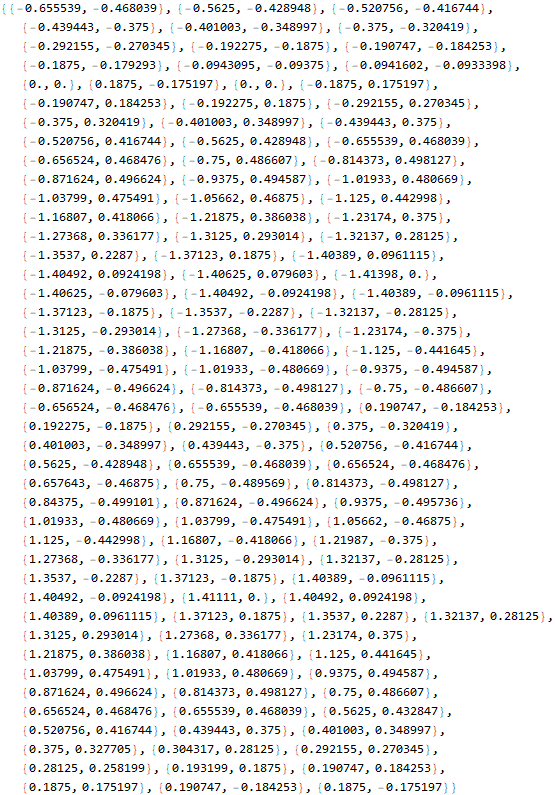
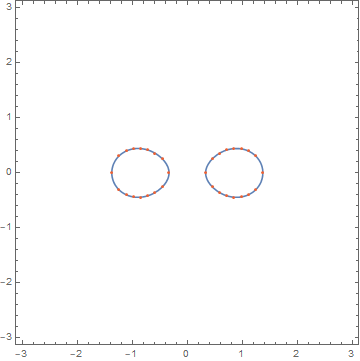
Dimensions[pts = Cases[Normal[%], Point[p_] :> p, ∞]]
   {32, 2}

ListPlot[pts, AspectRatio -> Automatic]

sampled points

$\endgroup$
2
  • $\begingroup$ This does not work in (my) V12.1.0 (MacOS). It should, though, so +1. AFAICT, only the last of the MeshFunctions is used. The example in the docs (last one under Options > Mesh) does not produce the output shown, either. I guess it's a bug. $\endgroup$
    – Michael E2
    Commented Apr 17, 2020 at 12:41
  • $\begingroup$ I'm still stuck on 11.2, so it's a little sad to hear that it doesn't work as expected in newer versions. Thanks for checking! $\endgroup$ Commented Apr 17, 2020 at 12:47
4
$\begingroup$

For random sampling, one can use regions and RandomPoint:

dist[x_, y_] = Sqrt[(x - #1)^2. + (y - #2)^2.] &;
ff[x_, y_] = dist[-1, 0][x, y] dist[1, 0][x, y];

reg = DiscretizeGraphics@
   ContourPlot[ff[x, y] == 1/2, {x, -3, 3}, {y, -3, 3}];

pts = RandomPoint[reg, 100];
Graphics[{
  Point@pts
  }, Frame -> True]

enter image description here

One can also use ImplicitRegion, which results in highly accurate pts at a cost of a longer computation:

reg = ImplicitRegion[ff[x, y] == 1/2, {{x, -3, 3}, {y, -3, 3}}];

You can compare the accuracy with

ff @@@ pts - 1/2  (* change 1/2 to suit contour level *)
$\endgroup$
3
$\begingroup$

FindInstance can work here:

P = {x, y} /. FindInstance[f[x, y] == 0.6, {x, y}, Reals, 10^2]

(*    {{1.09138, 0.269467}, {-1.24726, 0.100017}, {-0.922089, 0.298462},
       ...
       {-0.696263, 0.177498}, {0.972681, -0.299466}, {0.70461, -0.187505}}    *)

ListPlot[P]

enter image description here

old answer

Using exact exponents 2 instead of 2.:

dist[x_, y_] = Sqrt[(x - #1)^2 + (y - #2)^2] &;
f[x_, y_] = dist[-1, 0][x, y] dist[1, 0][x, y];

Use Solve:

Y[t_, x_] = y /. Solve[f[x, y] == t, y, Reals]

Example:

Y[0.6, 0.7]
{-0.182084, 0.182084}

You can now make tables of $(x,y)$ pairs for given $t$.

$\endgroup$

Your Answer

By clicking “Post Your Answer”, you agree to our terms of service and acknowledge you have read our privacy policy.

Not the answer you're looking for? Browse other questions tagged or ask your own question.