4
$\begingroup$

Consider some data (distr.dat). It is a tabulated PDF: x, y, z, PDF[x,y,z], where x is some parameter (and the integral of PDF[x,y,z] over y,z for the fixed x should give 1). I would like to sample points {y,z} according to the distribution for the given value of x (any value within the minimal and maximal value of x from data). This is how I do it: first, interpolate data logarithmically (just to accurately follow the shapes when it is changed exponentially fast), with the function named distr, then uniformly sample y,z in the domain of definition of the PDF, then calculate the weights, and, finally, produce the "true" y,z using RandomChoice:

(*Interpolating the distribution*)
data = Import[FileNameJoin[{NotebookDirectory[], "distr.dat"}], 
   "Table"];
distr[x_, y_, z_] = 
 10^Interpolation[
    Log10[{#[[1]], #[[2]], #[[3]], #[[4]] + 10^-90} & /@ data], 
    InterpolationOrder -> 1][Log10[x], Log10[y], Log10[z]]
(*Generating the random y,z points - unweighted*)
{xminmax, yminmax, zminmax} = MinMax[data[[All, #]]] & /@ {1, 2, 3};
NevtsUnw = 10^6;
yzrandgrid = 
  Join[RandomReal[yminmax, {NevtsUnw, 1}], 
   RandomReal[zminmax, {NevtsUnw, 1}], 2];
(*Calculating weights*)
xval = RandomReal[xminmax];
distrtemp[y_, z_] = distr[xval, y, z];
weights = distrtemp @@@ yzrandgrid; // AbsoluteTiming
(*Final "true" points*)
NevFinal = 5*10^5;
truepoints = 
   RandomChoice[weights -> yzrandgrid, NevFinal]; // AbsoluteTiming

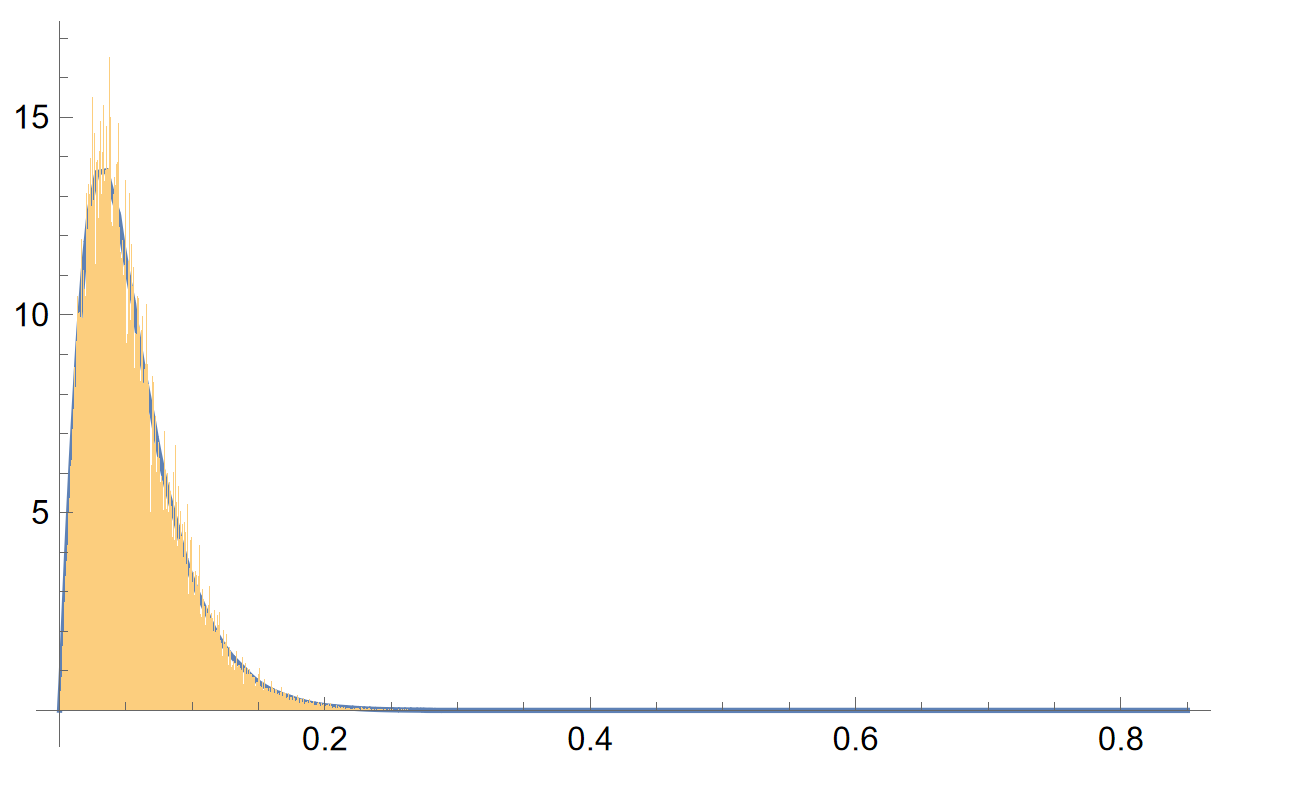
The resulting points follow the distribution, although not accurate enough. This is because the distribution is highly non-uniform (for instance, it is peaked at small y), while the unweighted data is distributed uniformly. Let me illustrate this by comparing the marginal distribution in y with the corresponding histogram obtained using the generated sample:

pdf1[y_] = 
  10^Interpolation[
     ParallelTable[{y, 
       Log10[Quiet[
         NIntegrate[
          distrtemp[10^y, Exp[z]] Exp[z], {z, Log[zminmax[[1]]], 
           Log[zminmax[[2]]]}, 
          Method -> "InterpolationPointsSubdivision"]]]}, {y, 
       Log10[yminmax[[1]]], 
       Log10[yminmax[[2]]], (Log10[yminmax[[2]]] - 
         Log10[yminmax[[1]]])/50}], InterpolationOrder -> 1][Log10[y]];
Show[Plot[pdf1[y], {y, yminmax[[1]], yminmax[[2]]}, PlotRange -> All],
  Histogram[truepoints[[All, 1]], 500, "ProbabilityDensity"]]

enter image description here

The slowest part is weights = distrtemp @@@ yzrandgrid;. As for distr, I use a Mathematica built-in interpolation, which slows things down significantly, taking 8-9 seconds on my laptop. There are much faster ways to interpolate. For instance, these answers allow one to map the interpolated data into a structured grid much-much faster than the ordinary interpolation does, but it is not obvious whether it is possible to adapt them to the unstructured grid as in the question.

Is there any way to speed it up significantly, or is there another method allowing to sample the points quickly and accurately?

Edit

The interpolation may be sped up using the combination of the method from this question (which fastly maps the grid x,y,z,PDF[x,y,z] onto y,z,PDF[X,y,z], where X is any desirable value within the grid for x) and this question (100X faster interpolation than the built-in one).

$\endgroup$
7
  • $\begingroup$ Sorry, another question: is the raw data available for a value of x? I ask because if a smooth kernel estimate of the bivariate density was available, then random samples from the bivariate distribution would be extremely straightforward. $\endgroup$
    – JimB
    Commented Dec 7, 2023 at 22:18
  • $\begingroup$ @JimB : to clarify, are you asking about having the table {y,z,f[x,y,z]} for any given value of x? $\endgroup$ Commented Dec 7, 2023 at 22:25
  • $\begingroup$ @JimB : what I have is only this table {x,y,z,pdf[x,y,z]}. I may, however, quickly convert it to {y,z,pdf[x,y,z]} for any value of x using the method from this question: mathematica.stackexchange.com/questions/282637/… . $\endgroup$ Commented Dec 7, 2023 at 22:30
  • $\begingroup$ How about using NORTA transformation or polynomial chaos expansion to convert the desired random variable from normal random numbers that can be sampled quickly? $\endgroup$
    – Xminer
    Commented Dec 8, 2023 at 19:36
  • $\begingroup$ Can you show the code you use to get the area under the bivariate surface to be 1? When I use NIntegrate[distr[0.05, y, z], {y, yminmax[[1]], yminmax[[2]]}, {z, zminmax[[1]], zminmax[[2]]}], I get 0.969948. Or am I doing it wrong? $\endgroup$
    – JimB
    Commented Dec 9, 2023 at 16:34

1 Answer 1

3
$\begingroup$

The approach here is for a given value of x to find the marginal distribution of y and then the conditional distribution of z. This allows obtaining random samples from a bivariate distribution in two steps.

The data structure that is used to characterize the bivariate density is not well-suited to generate samples from that density. Maybe it's well-suited to objectives not stated.

(* Obtain data *)
data = Import["distr.dat", "Data"];
(* Just consider x = 0.05 *)
data = Select[data, #[[1]] == 0.05 &];
(* Produce a structure that `Interpolation` requires *)
data = {{#[[2]], #[[3]]}, #[[4]]} & /@ data;

(* Determine a list of the unique y and z values *)
yvalues = data[[All, 1, 1]] // Sort // DeleteDuplicates;
zvalues = data[[All, 1, 2]] // Sort // DeleteDuplicates;

(* Adjust density values so that the area under the surface is 1 *)
(* This is only to make this example work and it is not a recommended practice.
   How the bivariate density values integrate to 1 should be fully explained. *)
(* Estimate the bivariate pdf at values not in the data structure using linear interpolation *)
jointPDF = Interpolation[data, InterpolationOrder -> 1];
{ymin, ymax} = MinMax[data[[All, 1, 1]]];
{zmin, zmax} = MinMax[data[[All, 1, 2]]];
adjust = 
 NIntegrate[jointPDF[y, z], {y, ymin, ymax}, {z, zmin, zmax}] // 
  Quiet
(* 0.9965776881269035` *)

This doesn't integrate to 1 so we divide by the value of adjust.

data[[All, 2]] = data[[All, 2]]/adjust;
jointPDF = Interpolation[data, InterpolationOrder -> 1];
(* Check that the jointPDF now integrates to 1 *)
NIntegrate[jointPDF[y, z], {y, ymin, ymax}, {z, zmin, zmax}] // Quiet
(* 1. *)

Now we find the marginal pdf of y by integrating over z.

pdfy = Interpolation[{#, NIntegrate[jointPDF[#, z], {z, zmin, zmax}]} & /@ yvalues, InterpolationOrder -> 1];

(* Construct inverse cdf for y *)
inversecdfy = 
  Interpolation[{NIntegrate[pdfy[yy], {yy, ymin, #}], #} & /@ yvalues,
    InterpolationOrder -> 1];

(* Find inverse cdf for z given y *)
zdata = ConstantArray[{{0, 0}, 0}, Length[yvalues] Length[zvalues]];
k = 0;
Do[
 temp = {#[[1, 2]], #[[2]]} & /@ 
   Select[data, #[[1, 1]] == yvalues[[i]] &];
 zz = Interpolation[temp, InterpolationOrder -> 1];
 area = NIntegrate[zz[z], {z, zmin, zmax}];
  Do[k = k + 1; 
    zdata[[k]] = {{yvalues[[i]], NIntegrate[zz[z], {z, zmin, zvalues[[j]]}]/area}, zvalues[[j]]},
    {j, Length[zvalues]}],
  {i, Length[yvalues]}]
(* Remove cdf values extremely close to 0 or 1 to stop `Interpolation` from complaining *) 
zdata = Select[zdata, 10^-13 < #[[1, 2]] < 1 - 10^-13 &];
inversecdfz = Interpolation[zdata, InterpolationOrder -> 1];

Now we can select from y and then select z conditional on y.

n = 10000;  (* Sample size *)
SeedRandom[12345];
AbsoluteTiming[ySample = inversecdfy[#] & /@ RandomReal[{0, 1}, n];
 zSample = inversecdfz[#[[1]], #[[2]]] & /@ Transpose[{ySample, RandomReal[{0, 1}, n]}];]
(* {0.0697075`,Null} *)

ListPlot[Transpose[{ySample, zSample}], PlotRange -> All, PlotStyle -> PointSize[0.001],
  Frame -> True, FrameLabel -> (Style[#, Bold, 18] &) /@ {"y", "z"}, ImageSize -> Large]

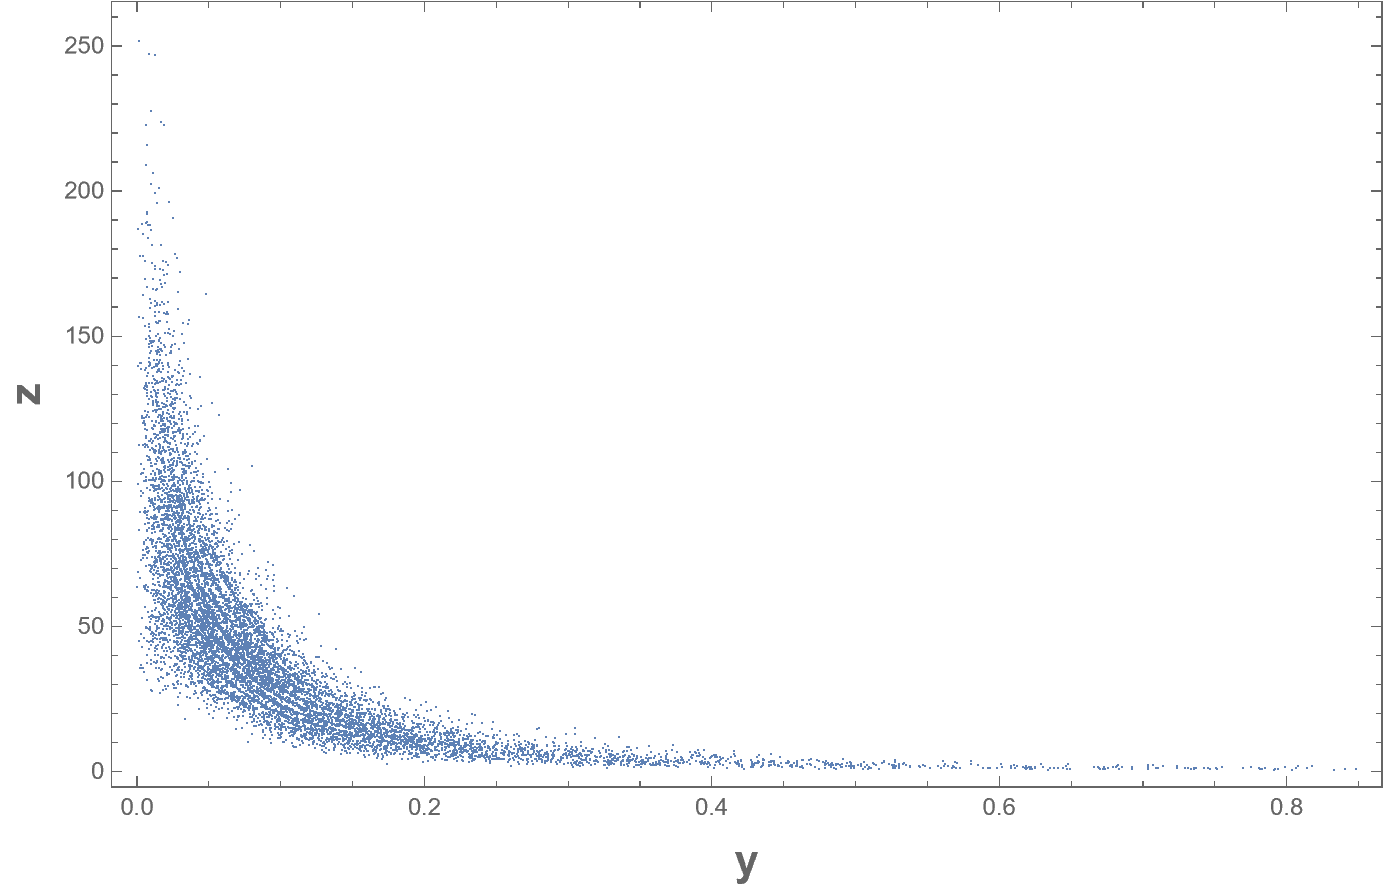
Random sample from bivariate distribution

There seems to be some structure in the cloud of points which I suspect is due to the discreteness of the representation of the bivariate density and the use of linear interpolation.

$\endgroup$
0

Your Answer

By clicking “Post Your Answer”, you agree to our terms of service and acknowledge you have read our privacy policy.

Not the answer you're looking for? Browse other questions tagged or ask your own question.