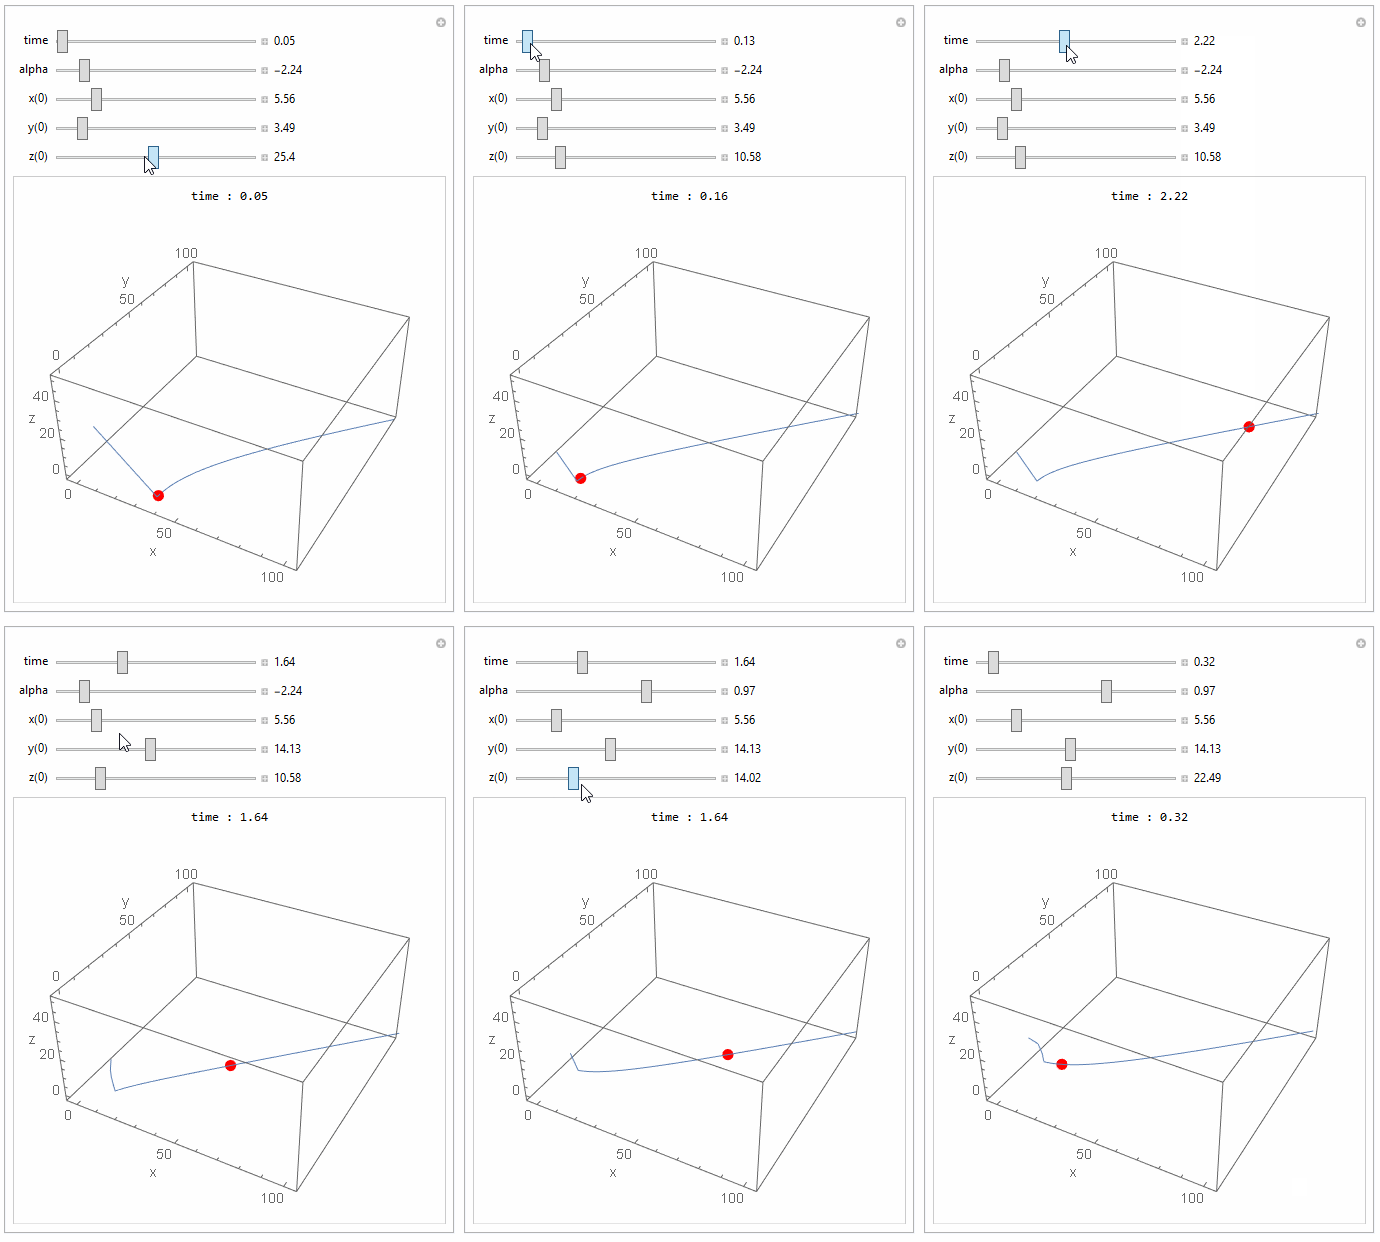
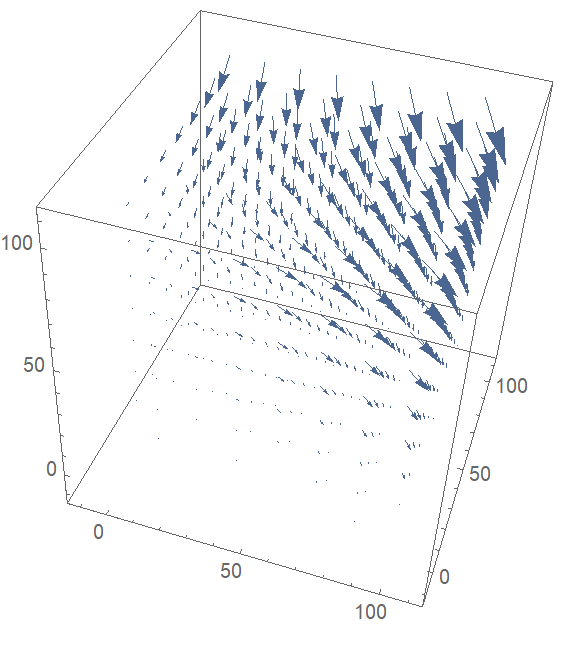
I have a system of equations: \begin{equation} \dot{x}=y-\alpha xz^2 \\ \dot{y}=x+ \alpha yz^2 \\ \dot{z}=-z(x^2+y^2) \end{equation} How can I create a 3D phase plane of this system that I can use for global analysis? I want to be able to see how this system behaves for all initial conditions. Here is what I tried:
FunSystem[\[Alpha]_, i_, l_, k_] = {x'[t] == y[t] - \[Alpha] x[t] z[t]^2,y'[t] == x[t] + \[Alpha] y[t] z[t]^2,z'[t] == -z[t] (x[t]^2 + y[t]^2), x[0] == i, y[0] == l, z[0] == k};
sol = NDSolve[FunSystem[\[Alpha], 0, 0, 0], {x, y, z}, {t, 0, 100}];
ParametricPlot3D[Evaluate[{x[t], y[t], z[t]} /. sol], {t, 0, 100},ColorFunction -> (Hue[#4] &), BoxRatios -> 1,AxesLabel -> {x[t], y[t], z[t]}, ImageSize -> 300]
Only a little dot is showing up because I set the initial conditions to all be 0. Is there any way I can create a manipulate plot to work with this?


{{x1,y1,z1}, {x2,y2,z2}...}) as follows: Start with user defined ICs and get the lists fromNDSolve. Make a pool of initial ICs (say a 3D grid covering the plot region). Repeat: (1) Remove points from the grid that within a given radius of the points in the current lines; (2) Pick a point from the pool of ICs, integrate withNDSolve, and add the line to your list; repeat (1) and (2) until there are no more ICs. -- You tend to get a plate of spaghetti, though. $\endgroup$