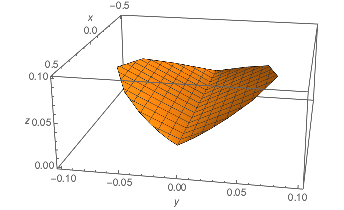
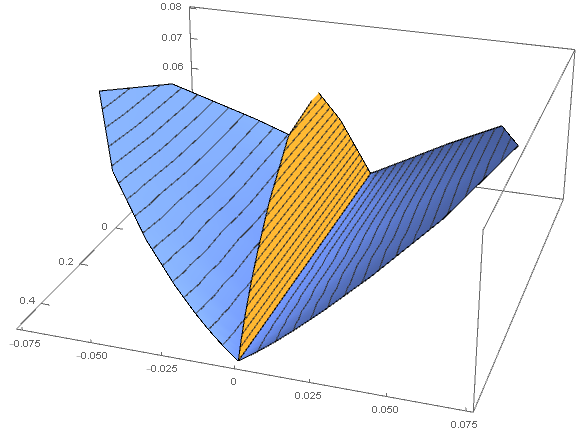
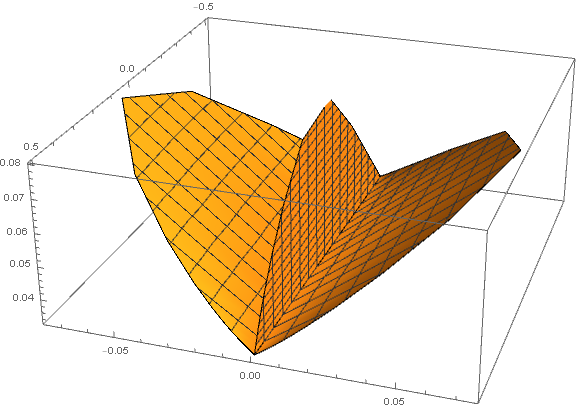
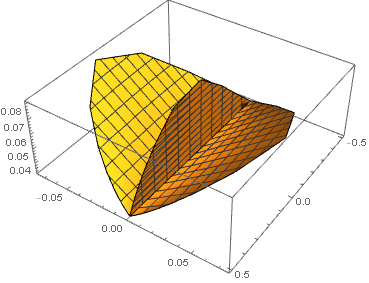
I have two sets of data. data1, boundary points of the two yellow surfaces shown below, are correctly plotted. However, data2, points almost in the vertical $y=0$-plane, do not show up. data2 is more or less like that the two leaves of data1 close and coincide in the $y=0$-plane.
I want to show both data sets together (Edit: and their colors chosen automatically by PlotTheme -> "Business" as they're normally rendered). Is there any way out?
ListPlot3D[{data1, data2}, PlotRange -> {{-0.5, 0.5}, {-0.1, 0.1}, {0, 0.1}}, PlotTheme -> "Business", AxesLabel -> {x, y, z}]
The data are as follows
{data1, data2}={{{-0.498888, -3.19621*10^-25, 0.0333333}, {-0.473122, -0.00470247,
   0.0363173}, {-0.403804, -0.0176968,
   0.0445669}, {-0.301622, -0.0371004,
   0.0568813}, {-0.150161, -0.0618223,
   0.0724944}, {0.0848717, -0.0741708,
   0.0794865}, {0.275171, -0.0567612,
   0.0671902}, {0.378431, -0.0384026,
   0.0551864}, {0.431566, -0.0254112,
   0.0471327}, {0.458987, -0.0170245,
   0.0421882}, {0.473576, -0.0117328,
   0.0392161}, {0.481711, -0.00837124,
   0.0374124}, {0.486505, -0.00618227,
   0.0362863}, {0.489508, -0.00469733,
   0.0355513}, {0.491537, -0.00362577,
   0.0350384}, {0.493065, -0.00278219,
   0.0346445}, {0.494405, -0.00204806,
   0.0343046}, {0.495751, -0.00136093,
   0.0339839}, {0.497136, -0.000724309,
   0.0336822}, {0.498332, -0.000221891,
   0.0334408}, {0.498885, -1.20715*10^-6, 0.0333339}, {-0.498888, 0.,
   0.0333333}, {-0.473122, 0., 0.0333333}, {-0.403804, 0.,
   0.0333333}, {-0.301622, 0., 0.0333333}, {-0.150161, 0.,
   0.0333333}, {0.0848717, 0., 0.0333333}, {0.275171, 0.,
   0.0333333}, {0.378431, 0., 0.0333333}, {0.431566, 0.,
   0.0333333}, {0.458987, 0., 0.0333333}, {0.473576, 0.,
   0.0333333}, {0.481711, 0., 0.0333333}, {0.486505, 0.,
   0.0333333}, {0.489508, 0., 0.0333333}, {0.491537, 0.,
   0.0333333}, {0.493065, 0., 0.0333333}, {0.494405, 0.,
   0.0333333}, {0.495751, 0., 0.0333333}, {0.497136, 0.,
   0.0333333}, {0.498332, 0., 0.0333333}, {0.498885, 0.,
   0.0333333}, {-0.498888, 3.19621*10^-25, 0.0333333}, {-0.473122,
   0.00470247, 0.0363173}, {-0.403804, 0.0176968,
   0.0445669}, {-0.301622, 0.0371004, 0.0568813}, {-0.150161,
   0.0618223, 0.0724944}, {0.0848717, 0.0741708,
   0.0794865}, {0.275171, 0.0567612, 0.0671902}, {0.378431, 0.0384026,
    0.0551864}, {0.431566, 0.0254112, 0.0471327}, {0.458987,
   0.0170245, 0.0421882}, {0.473576, 0.0117328, 0.0392161}, {0.481711,
    0.00837124, 0.0374124}, {0.486505, 0.00618227,
   0.0362863}, {0.489508, 0.00469733, 0.0355513}, {0.491537,
   0.00362577, 0.0350384}, {0.493065, 0.00278219,
   0.0346445}, {0.494405, 0.00204806, 0.0343046}, {0.495751,
   0.00136093, 0.0339839}, {0.497136, 0.000724309,
   0.0336822}, {0.498332, 0.000221891, 0.0334408}, {0.498885,
   1.20715*10^-6, 0.0333339}}, {{-0.498888, -9.72703*10^-25,
   0.0333333}, {-0.456846, -1.51447*10^-18,
   0.037797}, {-0.354429, -5.33941*10^-18,
   0.0490817}, {-0.220841, -1.05463*10^-17,
   0.0644295}, {-0.0421324, -1.62937*10^-17,
   0.0810826}, {0.163827, -1.57394*10^-17,
   0.0781084}, {0.295344, -1.19327*10^-17,
   0.0660401}, {0.371789, -8.73286*10^-18,
   0.0564082}, {0.41643, -6.41942*10^-18,
   0.0497166}, {0.443037, -4.80383*10^-18,
   0.0452114}, {0.459355, -3.67756*10^-18,
   0.0421786}, {0.4697, -2.88168*10^-18,
   0.0401073}, {0.4765, -2.30525*10^-18,
   0.038657}, {0.481163, -1.8717*10^-18,
   0.0376029}, {0.484553, -1.52674*10^-18,
   0.0367919}, {0.487254, -1.22976*10^-18,
   0.0361134}, {0.489711, -9.49526*10^-19,
   0.0354838}, {0.492259, -6.65265*10^-19,
   0.0348463}, {0.495015, -3.7648*10^-19,
   0.0341936}, {0.49759, -1.23131*10^-19,
   0.0336157}, {0.49888, -7.01073*10^-22, 0.0333349}, {-0.498888, 0.,
   0.0333333}, {-0.456846, 0., 0.0333333}, {-0.354429, 0.,
   0.0333333}, {-0.220841, 0., 0.0333333}, {-0.0421324, 0.,
   0.0333333}, {0.163827, 0., 0.0333333}, {0.295344, 0.,
   0.0333333}, {0.371789, 0., 0.0333333}, {0.41643, 0.,
   0.0333333}, {0.443037, 0., 0.0333333}, {0.459355, 0.,
   0.0333333}, {0.4697, 0., 0.0333333}, {0.4765, 0.,
   0.0333333}, {0.481163, 0., 0.0333333}, {0.484553, 0.,
   0.0333333}, {0.487254, 0., 0.0333333}, {0.489711, 0.,
   0.0333333}, {0.492259, 0., 0.0333333}, {0.495015, 0.,
   0.0333333}, {0.49759, 0., 0.0333333}, {0.49888, 0., 0.0333333}}};


Polygonondata2like:Show[ListPlot3D[data1, PlotRange -> {{-0.5, 0.5}, {-0.1, 0.1}, {0, 0.1}}, AxesLabel -> {x, y, z}], Graphics3D[Polygon[data2]]]. $\endgroup$ListPlot3Ddoes. I'd like to use the same style to show them together. $\endgroup$