2
$\begingroup$

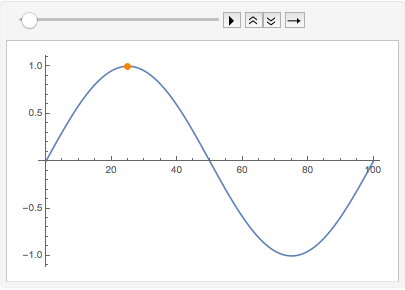
I have a ListAnimate plot and I want to track the position of the peak as it moves.

Is there any way to do this which takes into account the fact that the peak of the wave moves past the window of the plot on the right hand side.

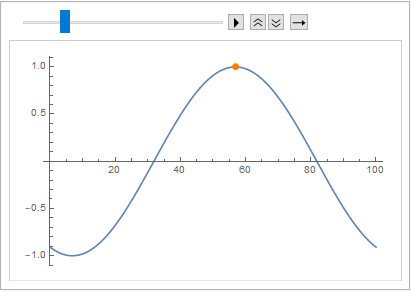
ListAnimate[Table[ListLinePlot[Table[Sin[2*Pi*i/100 - j], {i, 0, 100}]], {j,0,10}]]

Any help is greatly appreciated!

Edit:

The value for distance traveled should keep counting and not reset each time it passes the point it began.

Is there any way to do this which takes into account the fact that the peak of the wave moves past the window of the plot on the right hand side.
$\endgroup$

2 Answers 2

3
$\begingroup$
ListAnimate[Table[With[{t = Table[{i, Sin[2*Pi*i/100 - j]}, {i, 0, 100}]}, 
     ListLinePlot[t, Epilog -> {Orange, PointSize[Large], Point@MaximalBy[Last][N@t]}]], 
   {j, 0, 10}]]

enter image description here

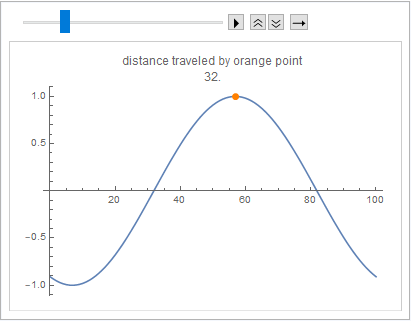
Update:

firstpeak = First@MaximalBy[Last][N@Table[{i, Sin[2*Pi*i/100]}, {i, 0, 100}]];

ListAnimate[Table[With[{t = Table[{i, Sin[2*Pi*i/100 - j]}, {i, 0, 100}]}, 
   ListLinePlot[t, 
    Epilog -> {Orange, PointSize[Large], 
      Point[currentpeak = MaximalBy[Last][N@t]]}, 
    PlotLabel -> Column[{"distance traveled by orange point", 
       ArcLength[Line[{firstpeak, First@currentpeak}]]}, 
      Alignment -> Center]]], 
  {j, 0, 10}]]

enter image description here

$\endgroup$
4
  • $\begingroup$ Is there anyway to find the total distance that the orange point "travels" during the animation and extract this separately? $\endgroup$
    – James
    Commented Feb 16, 2020 at 23:44
  • $\begingroup$ @James, please see the update. $\endgroup$
    – kglr
    Commented Feb 17, 2020 at 0:03
  • $\begingroup$ What I mean is the cumulative distance the peak travels. The value for distance traveled should keep counting and not reset each time it passes the point it began. Also, is there a way to view these values as a list and not as past of the plot label? $\endgroup$
    – James
    Commented Feb 17, 2020 at 0:10
  • $\begingroup$ @James, I suggest you update your question with the additional requirements you have posted in comments (or, better yet, post them as new questions). $\endgroup$
    – kglr
    Commented Feb 17, 2020 at 0:16
1
$\begingroup$

Would something like this do what you want:

ClearAll[values, maxValues, valuesAndMax];
values = Table[{i, Sin[2*Pi*i/100 - j]}, {j, 0, 10}, {i, 0, 100}];
maxValues = 
  Flatten[#, 
     1] & /@ (With[{max = Max[#[[;; , -1]]]}, 
       Select[#, #[[2]] == max &]] & /@ values);
valuesAndMax = Transpose[{maxValues, values}];
ListAnimate[
 ListLinePlot[#[[2]], 
    Epilog -> {Orange, PointSize -> .02, Point[#[[1]]]}] & /@ 
  valuesAndMax]

Mathematica graphics

The max value is shown as an orange point that moves with the graphs.

$\endgroup$
1
  • $\begingroup$ Is there anyway to find the total distance that the orange point "travels" during the animation and extract this separately? $\endgroup$
    – James
    Commented Feb 16, 2020 at 22:24

Your Answer

By clicking “Post Your Answer”, you agree to our terms of service and acknowledge you have read our privacy policy.

Not the answer you're looking for? Browse other questions tagged or ask your own question.