added 586 characters in body
Source Link
kglr
  • 400.5k
  • 18
  • 488
  • 929
ListAnimate[Table[With[{t = Table[{i, Sin[2*Pi*i/100 - j]}, {i, 0, 100}]}, 
     ListLinePlot[t, Epilog -> {Orange, PointSize[Large], Point@MaximalBy[Last][N@t]}]], 
   {j, 0, 10}]]

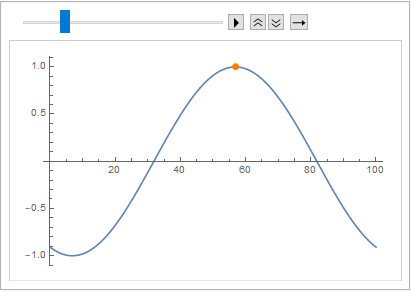
enter image description here

Update:

firstpeak = First@MaximalBy[Last][N@Table[{i, Sin[2*Pi*i/100]}, {i, 0, 100}]];

ListAnimate[Table[With[{t = Table[{i, Sin[2*Pi*i/100 - j]}, {i, 0, 100}]}, 
   ListLinePlot[t, 
    Epilog -> {Orange, PointSize[Large], 
      Point[currentpeak = MaximalBy[Last][N@t]]}, 
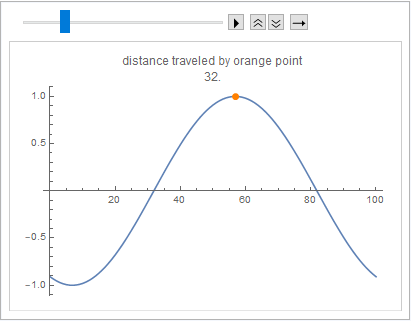
    PlotLabel -> Column[{"distance traveled by orange point", 
       ArcLength[Line[{firstpeak, First@currentpeak}]]}, 
      Alignment -> Center]]], 
  {j, 0, 10}]]

enter image description here

ListAnimate[Table[With[{t = Table[{i, Sin[2*Pi*i/100 - j]}, {i, 0, 100}]}, 
     ListLinePlot[t, Epilog -> {Orange, PointSize[Large], Point@MaximalBy[Last][N@t]}]], 
   {j, 0, 10}]]

enter image description here

ListAnimate[Table[With[{t = Table[{i, Sin[2*Pi*i/100 - j]}, {i, 0, 100}]}, 
     ListLinePlot[t, Epilog -> {Orange, PointSize[Large], Point@MaximalBy[Last][N@t]}]], 
   {j, 0, 10}]]

enter image description here

Update:

firstpeak = First@MaximalBy[Last][N@Table[{i, Sin[2*Pi*i/100]}, {i, 0, 100}]];

ListAnimate[Table[With[{t = Table[{i, Sin[2*Pi*i/100 - j]}, {i, 0, 100}]}, 
   ListLinePlot[t, 
    Epilog -> {Orange, PointSize[Large], 
      Point[currentpeak = MaximalBy[Last][N@t]]}, 
    PlotLabel -> Column[{"distance traveled by orange point", 
       ArcLength[Line[{firstpeak, First@currentpeak}]]}, 
      Alignment -> Center]]], 
  {j, 0, 10}]]
enter image description here

Source Link
kglr
  • 400.5k
  • 18
  • 488
  • 929

ListAnimate[Table[With[{t = Table[{i, Sin[2*Pi*i/100 - j]}, {i, 0, 100}]}, 
     ListLinePlot[t, Epilog -> {Orange, PointSize[Large], Point@MaximalBy[Last][N@t]}]], 
   {j, 0, 10}]]

enter image description here