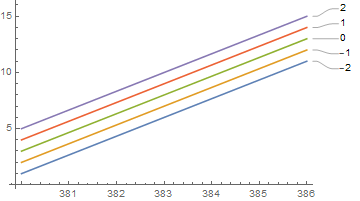
I'm trying to write some automated data analysis code for my research group, but I've run into a snag with Mathematica which I just can't seem to iron out.
We generate data of the form:
{{0,-2,-1,0,1,2...},
 {380,1,2,3,4,5...},
 {384,6,7,8,9,10...},
 .
 .
 .
}
Where, if the matrix is called data, data[[1,2;;]] is a selection of Voltage values, and data[[2;;,1]] is a selection of Wavelength values. data[[2;;,2;;]] gives Intensity.
I know that the wavelength values are defined by the instrument, but the voltage sweep is user-defined, so its dimensions are not fixed.
In MatLab, I would do the following:
a=size(data);
hold on
for i=2:a(2)
    plot(wavelength,data(2:end,i))
end
and this would generate my desired result of a single plot, with multiple traces each corresponding to a given measurement.
In Mathematica, I've tried several methods each without success. Because ListLinePlot expects a list of form {x1,y1},{x2,y2},... I figure there must be some obvious way to treat the data to achieve the desired result, but I haven't found it. If there were an equivalent hold on function in Mathematica, I would do the following:
HoldOn
Do[
ListLinePlot[{Wavelength,data[[2;;,t]]}//Transpose],
{t,2,Dimensions[data][[2]]}
]
But as far as I can find, such a function doesn't exist.
Is there some slick way I can do this that I'm missing?
Thanks for reading

