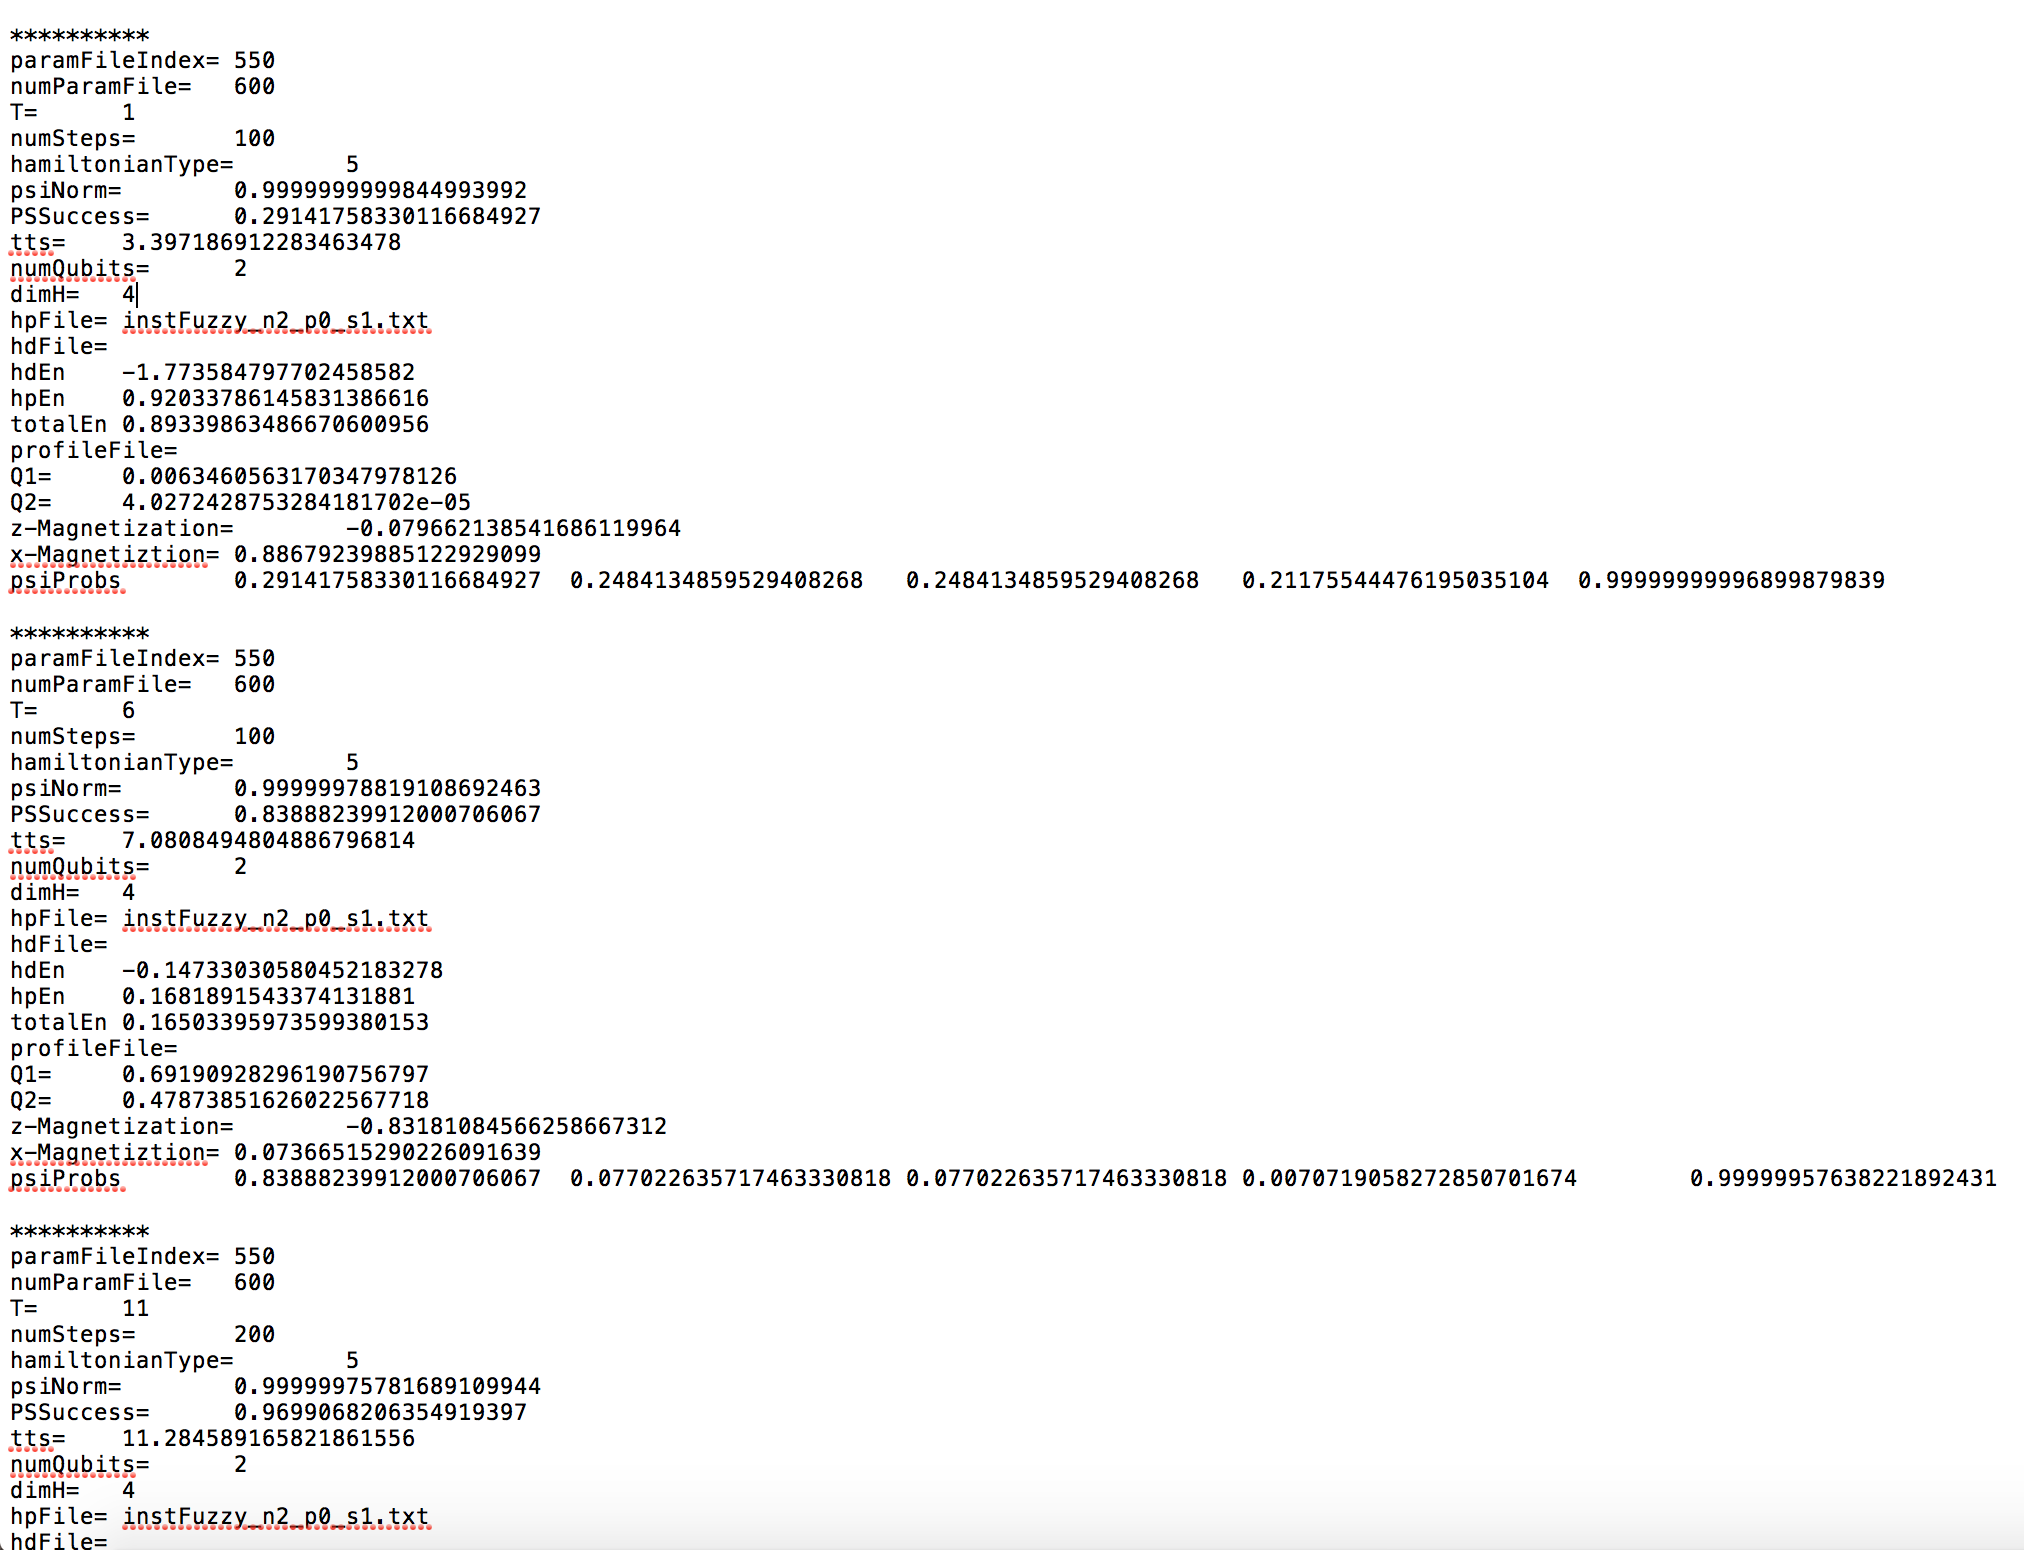
I'm new to mathematica and stack exchange, so any help would be appreciated. I want to plot a bunch of data from text files that contain a lot of extraneous data. I have a hundred files with different serial numbers. In each file, there are a series of "T" values (they are the same across all 100 files) and a series of "tts" values (they vary between serial numbers).
This is the format of the files:

Here is a pastebin link to an example of my data
I want to average all of the "tts" values that correspond to a given "T" value from all 100 files and generate a plot of this data for all given "T" values.
files=FileNames["*.txt","/dir"]

raw=Import[#,"Data"]&/@files

TList=Position[raw,"T="]
I'm trying to create a list of all "T" values based on the string that precedes all of these values. (I'll create a separate list of all "tts" values so I can average them later)
I am able to create a list of points using Position, however, it is not selecting the right numbers to put in to the list despite the string I'm using being uniform for all "T" values through all the files. It seems it is taking some of the right numbers and appending wrong ones as well.
Any tips or a better approach?
