0
$\begingroup$

I have a lot of points that I would like to get shown on a plot. The problem is that sometimes I only have 2 points while other times i have 10 points. I've tried to make a for loop to create a plot with the points but without any luck. This is my code I have for now:

Point1 = {x -> 2, y -> 4};
point1dot = 
  ListPlot[{{Point1[[1, 2]], Point1[[2, 2]]}}, 
   PlotStyle -> {AbsolutePointSize[5]}];
Label1 = Graphics[
   Text[StyleForm["Point 1", FontSize -> 9], {Point1[[1, 2]] + 0.25, 
     Point1[[2, 2]] + 0.25}]];
Show[point1dot, Label1]

In this example there is only one point, but sometimes it will look like this:

Point1= {x -> 2, y-> 4};
Point2= {x -> 4, y-> -1};
Point3= {x -> 6, y-> 2};
Point4= {x -> 11, y-> 4};
Point5= {x -> 4, y-> 5};
Point6= {x -> 3, y-> -1};

It will become a great shortcut for my work if it could generate it itself instead of editing it manually all the time. So here is my question:

Is it possible to make some sort of for loop (it doesn't have to be for), that takes value from my points and create a listplot with the label based on the amount of different numbers?

$\endgroup$
4
  • $\begingroup$ You don't need your points to have the form {x -> x0, y -> y0}; ListPlot[] only needs a list of points (lists of length two), e.g ListPlot[{{2, 4}, {4, -1}}]. $\endgroup$ Commented Apr 15, 2013 at 10:51
  • $\begingroup$ Oh yes. I haven't told that I am given the Points, and therefore cannot change them. $\endgroup$ Commented Apr 15, 2013 at 10:58
  • 1
    $\begingroup$ You can extract the points using points = {x, y} /. {Point1, Point2, Point3, Point4, Point5, Point6} $\endgroup$
    – cormullion
    Commented Apr 15, 2013 at 11:03
  • $\begingroup$ cant change the points huh. oh yea, what say you to this im = WolframAlpha["chuck norris picture", "PodImages"][[2]]; Append[Symbol["Point"<>ToString[#]], im] & /@ Range[6] $\endgroup$
    – amr
    Commented Apr 15, 2013 at 15:54

2 Answers 2

4
$\begingroup$

Not sure what do you plan to do with it. Something doesn't sound right, but anyway:

plot[a : {{x -> _?NumericQ, y -> _?NumericQ} ..}] := 
    Show[ListPlot[#, PlotStyle -> AbsolutePointSize[5], 
                  Epilog -> MapIndexed[Inset[StyleForm["Point " ~~ ToString@#2[[1]], 
                            FontSize -> 9], #1 + .1] &, #]] &@({x, y} /. a)]

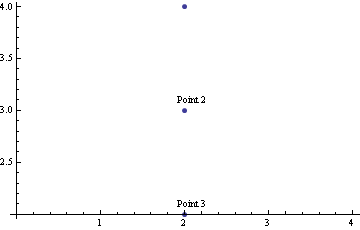
plot[{{x -> 2, y -> 4}, {x -> 2, y -> 3}, {x -> 2, y -> 2}}]

enter image description here

$\endgroup$
3
  • $\begingroup$ This was what I needed. However I wonder why when I want to show it with other plots the labels disappear. $\endgroup$ Commented Apr 15, 2013 at 13:12
  • $\begingroup$ @JensJensen Please post an example $\endgroup$ Commented Apr 15, 2013 at 13:14
  • $\begingroup$ With changing the PlotRange i solved the problem. $\endgroup$ Commented Apr 15, 2013 at 13:32
1
$\begingroup$
(* Create some points in a list *)
points = RandomInteger[10, {10, 2}];

(* Make some labels for each of the points,here they are the Sum of the coordinates *)
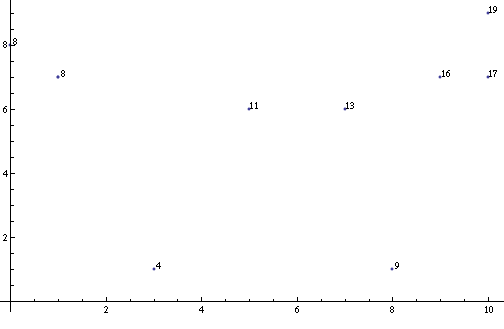
labels = Graphics[Text[Plus @@ #, {0.1, 0.1} + #] & /@ points];

(* Display the plot of the points and the associated labels *)
Show[ListPlot[points], labels]

enter image description here

$\endgroup$

Your Answer

By clicking “Post Your Answer”, you agree to our terms of service and acknowledge you have read our privacy policy.

Not the answer you're looking for? Browse other questions tagged or ask your own question.