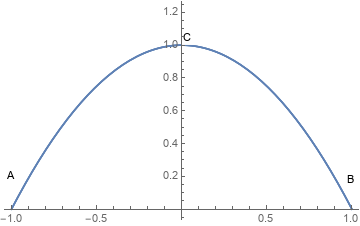
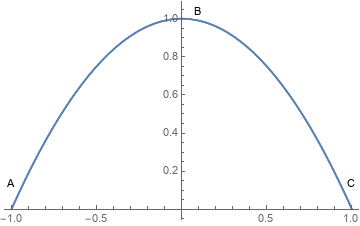
I am trying to add labels to a plot in specific positions. I give a simple example:
Plot[1 - x^2, {x, -1, 1},
    PlotLabels -> Placed[{"A", "B", "C"},
    {{-1,Left},{0, Above}, {1, Right}}]]
So I would like to have the labels A, B, C at the locations x=-1,0,1 of the plot. I know of "Above", "Below", "Left", "Right" as locations for the labels to be placed. However I would like something like "Above Left" or "Above Right", so A and C are not intersecting the x-axis, and B is not intersection the y-axis.
Does that command exist?
Simply choosing the locations Above ±(1+epsilon) does not work, since the plot range is from -1 to 1.
If there is a way to fine-tune the concrete position that would also be nice to know how that works. I actually wouldn't necessarily require labels to a curve, but simply labels at some chosen coordinate in the plot.
Thanks for suggestions!


Plot[1 - x^2, {x, -1, 1}, PlotLabels -> Placed[{"A"}, {-1, Left}], PlotRange -> All]works for me as well as simplePlot[1 - x^2, {x, -1, 1}, PlotLabels -> Placed[{"A"}, {Left}], PlotRange -> All]. $\endgroup$