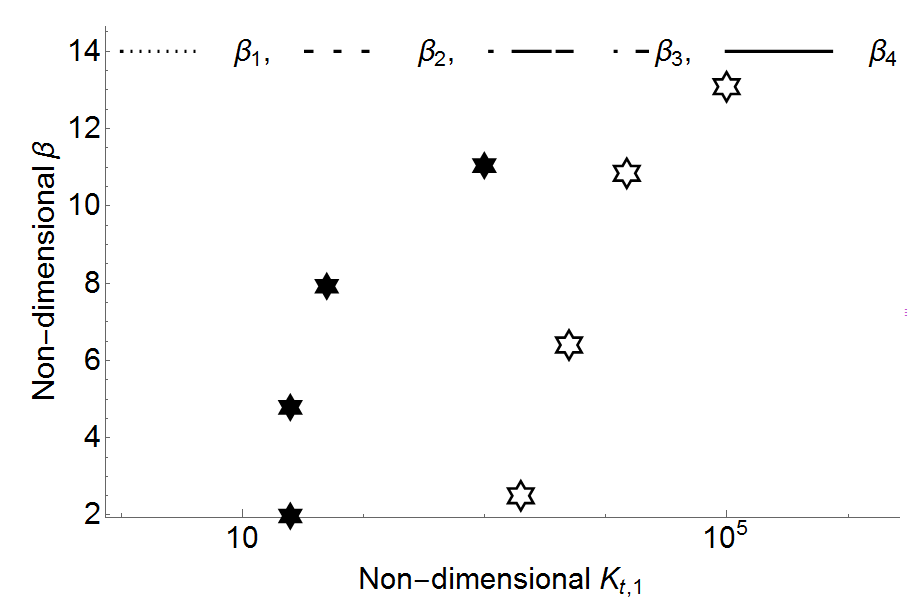
I am writing a small report, wherein I have several plots, some plots are on a linear-linear scale, some are in log-linear scale, some in log-log. The problem I am facing is every time I change my scale it is becoming very difficult for me to adjust the legend. right now I am customized my legend using line command and circle command of graphics. Is there any way to fix this suppose my plot image size is 1500 (which is fixed for all of my plots), with respect to this can I set my legends. . I don't have a
style1 = PlotStyle -> {Black, Thickness[0.004],
   AbsoluteDashing[{2, 7}]}
style2 = PlotStyle -> {Black, Thickness[0.004],
   AbsoluteDashing[{8, 20}]}
style3 = PlotStyle -> {Black, Thickness[0.004],
   AbsoluteDashing[{4, 18, 40}]}
p1 = Plot[Sin[π*x], {x, 0, 1}, Evaluate@style1];
p2 = Plot[Sin[2 π*x], {x, 0, 1}, Evaluate@style2];
p3 = Plot[Sin[3 π*x], {x, 0, 1}, Evaluate@style3];


s1 = Graphics[{Thickness[0.004], AbsoluteDashing[{2, 7}],
    Line[{{0, 14}, {1.5, 14}}],
    Text[StyleForm["\!\(\*SubscriptBox[\(β\), \(1\)]\),",
      FontSize -> 30], {2.5, 14}]}];
s2 = Graphics[{Thickness[0.004], AbsoluteDashing[{8, 20}],
    Line[{{3.5, 14}, {5, 14}}],
    Text[StyleForm["\!\(\*SubscriptBox[\(β\), \(2\)]\),",
      FontSize -> 30], {6, 14}]}];
s3 = Graphics[{Thickness[0.004], AbsoluteDashing[{4, 18, 40}],
    Line[{{7, 14}, {10, 14}}],
    Text[StyleForm["\!\(\*SubscriptBox[\(β\), \(3\)]\),",
      FontSize -> 30], {10.5, 14}]}];

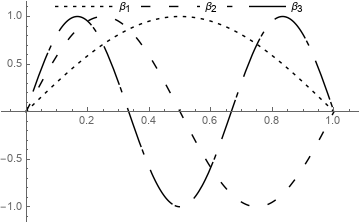
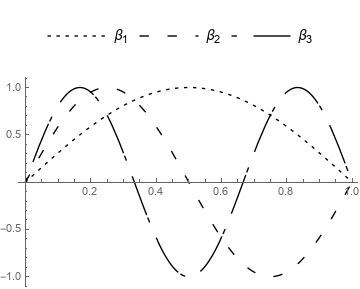
Show[p1, p2, p3,s1,s2,s3, PlotRange -> All]
The above plot is on a linear-linear scale I looking trying to fix the general legend for all type of scale.


