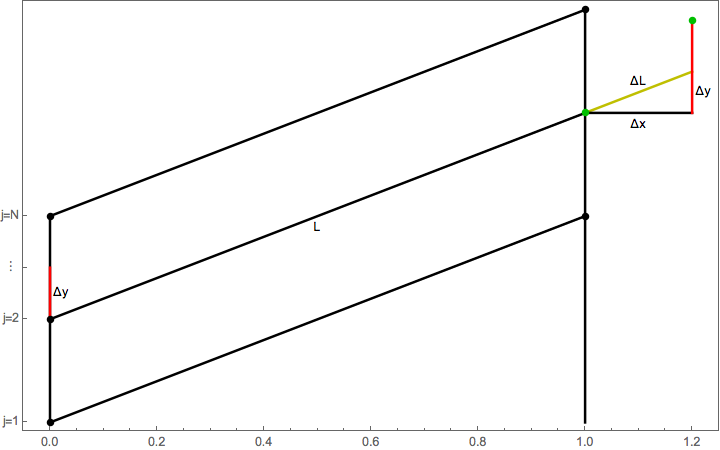
Plotting functions like ListLinePlot are not very good for drawing diagrams like the one you are trying to draw. It is better to use Graphics for that purpose. Here is how I rewrote your code using Graphics.
Data
d1 = Table[{i - 1, (j - 1)/2}, {i, 1}, {j, 3}];
d2 = Table[{i - 1, 1 + (j - 1)/2}, {i, 2, 2}, {j, 3}];
pts = Transpose[Join[d1, d2]] // Catenate // N;
Graphics
Module[{p0, p1, p2, p3, p4, p5, p6, p7, p8, p9, p10},
  p0 = {1, 0};
  {p1, p2, p3, p4, p5, p6} = pts;
  p7 = {0, 0.75};
  p8 = {1.2, 1.5};
  p9 = {1.2, 1.7};
  p10 = {1.2, 1.95};
  Graphics[
    {AbsolutePointSize[6], AbsoluteThickness[2],
      {Darker[Yellow, .25], Line[{p4, p9}]},
      {Black,
         Line[{p1, p2}], Line[{p3, p4}], Line[{p5, p6}],
         Line[{p4, p8}], Line[{p1, p5}], Line[{p0, p6}]},
      {Red, Line[{p3, p7}], Line[{p8, p10}]}, ,
      {Black, Point[{p1, p2, p3, p5, p6}]},
      {Darker[Green, .25], Point[{p4, p10}]},
      Text["Δx", (p4 + p8)/2, {0, 1.5}],
      Text["Δy", (p8 + p9)/2, {-1.5, 0}],
      Text["Δy", (p3 + p7)/2, {-1.5, 0}],
      Text["L", (p3 + p4)/2, {0, 1.5}],
      Text["ΔL", (p4 + p9)/2, {0, -1.5}]},
    PlotRange -> {{-.05, 1.25}, Automatic},
    AspectRatio -> 1/GoldenRatio,
    Frame -> True,
    FrameTicks ->
      {{{{0, "j=1"}, {1/2, "j=2"}, {(1/2) + (1/4), "  ⋮  "}, {3/3, "j=N"}}, None},
       {Automatic, False}},
    ImageSize -> Large]]

I hope I have interpreted your question correctly and the above code produces the diagram you are trying to create.
Note: In the Text expressions I have used Text's 3rd argument to nudge the labels so they do not sit right on the lines they are labelling. This is a common use of the 3rd argument.
Update
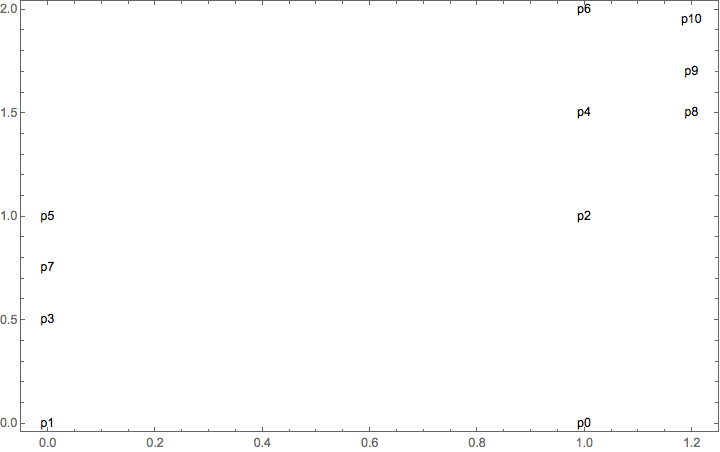
In case anyone is wondering how I kept track of which point was where in the graphic, perhaps I should confess that I first made this diagram:
Block[{p0, p1, p2, p3, p4, p5, p6, p7, p8, p9, p10},
  p0 = {1, 0};
  {p1, p2, p3, p4, p5, p6} = pts;
  p7 = {0, 0.75};
  p8 = {1.2, 1.5};
  p9 = {1.2, 1.7};
  p10 = {1.2, 1.95};
  Graphics[
    List @@
     (Text[SymbolName[Unevaluated[#]], #] & /@
        Unevaluated /@ Hold[p0, p1, p2, p3, p4, p5, p6, p7, p8, p9, p10]),
    PlotRange -> {{-.05, 1.25}, Automatic},
    AspectRatio -> 1/GoldenRatio,
    Frame -> True,
    ImageSize -> Large]]

When building a diagram which requires me to track a lot of points, I fined making such an auxiliary diagram first a great help.
2nd update
Although the the above code presents the way I generated labelled points when I began to work on this problem, the following method which had the virtue of being a bit simpler occurred to me. You may prefer to do it this way.
Block[{p0, p1, p2, p3, p4, p5, p6, p7, p8, p9, p10, lbls, allPts},
  lbls = SymbolName /@ {p0, p1, p2, p3, p4, p5, p6, p7, p8, p9, p10};
  p0 = {1, 0};
  {p1, p2, p3, p4, p5, p6} = pts;
  p7 = {0, 0.75};
  p8 = {1.2, 1.5};
  p9 = {1.2, 1.7};
  p10 = {1.2, 1.95};
  allPts = {p0, p1, p2, p3, p4, p5, p6, p7, p8, p9, p10};
  Graphics[
    MapThread[Text[#1, #2] &, {lbls, allPts}],
    PlotRange -> {{-.05, 1.25}, Automatic},
    AspectRatio -> 1/GoldenRatio,
    Frame -> True,
    ImageSize -> Large]]
This creates the same labelled point diagram as shown above.
3rd update
Just for completeness, here is another way to write the Text expressions for the line segment labels:
Text["Δx", Offset[{0, -8}, (p4 + p8)/2]],
Text["Δy", Offset[{10, 0}, (p8 + p9)/2]],
Text["Δy", Offset[{10, 0}, (p3 + p7)/2]],
Text["L", Offset[{0, -10}, (p3 + p4)/2]],
Text["ΔL", Offset[{0, 8}, (p4 + p9)/2]]},
Here I am using Offset in the 2nd argument to do the nudging and omitting the 3rd argument. The offsets are expressed in printers points which some people find easier to visualize than the special local coordinate system used by the 3rd argument.


ListLinePlotcalls into a single one with multiplePlotStyleargs, right? And the points can all easily be added withEpilogandPoint. The\[CapitalDelta]xand\[CapitalDelta]ycan be stuck in the epilog too by usingTextin its 4 argument form so that it rests above the line, centered on it, and pointing up the line as well. Presumably that should be enough for you, right? $\endgroup$