2
$\begingroup$

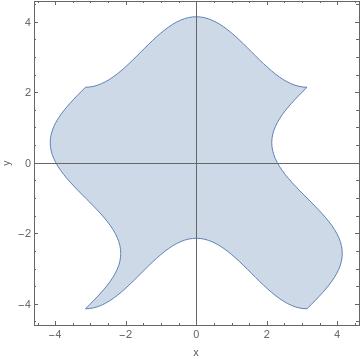
For example

ParametricPlot[{Sin[x] - y, Cos[y] - x}, {x, -\[Pi], \[Pi]}, {y, -\[Pi], \[Pi]}]

gives

enter image description here

What should I do to impose x^2+y^2==2 (actually it could be a more complicated function) and only plot for those parameters that satisfy that condition? Mesh didnt work.

$\endgroup$

1 Answer 1

2
$\begingroup$

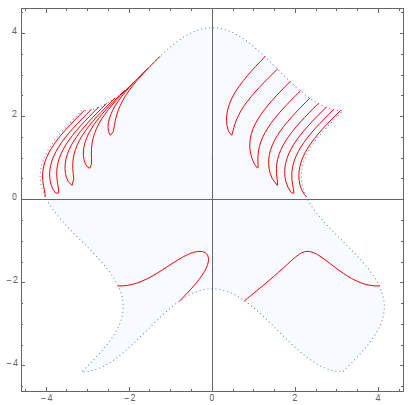
Perhaps:

 Quiet @ ParametricPlot[{Sin[x] - y, Cos[y] - x} , {x, -π, π}, {y, -π, π},  
   BoundaryStyle -> Dotted, 
   PlotStyle -> Opacity[.25, LightBlue], 
   MeshStyle -> Opacity[1, Red], 
   MeshFunctions -> {#3^+ #4^2 &}, 
   Mesh -> {{2}}]

enter image description here

Use BoundaryStyle -> None and PlotStyle -> None to hide the surface and its boundary.

$\endgroup$

Your Answer

By clicking “Post Your Answer”, you agree to our terms of service and acknowledge you have read our privacy policy.

Not the answer you're looking for? Browse other questions tagged or ask your own question.