2
$\begingroup$

I'm attempting to plot a phase plot for a 1d dynamical system, and mark the stable and unstable fixed point in empty and full point face color, but find it extremely difficult.

Can anyone pointout how to plot in the most simplified way empty and full circles in the same plot?

here is the code

    aa = 1.5;
f[x_] := a x - x^3;
Show[{Plot[f[x] /. a -> aa, {x, -2, 2}, 

   Ticks -> {{{-Sqrt[a] /. a -> aa, "-\!\(\*SqrtBox[\(a\)]\)"}, {0, 
       0}, {Sqrt[a] /. a -> aa, "\!\(\*SqrtBox[\(a\)]\)"}}, {{0, 
       0.1}}}, AxesLabel -> {"x", "f(x)"}, 
   Epilog -> {Black, PointSize@Large, Point[{0, 0}]}],
  VectorPlot[{a x - x^3 /. a -> aa, y}, {x, -2, 2}, {y, -0.1, 0.1}, 
   VectorPoints -> Table[{x, 0}, {x, -1.6, 1.6, 0.2}], 
   VectorScale -> Large]}]
$\endgroup$
3
  • $\begingroup$ Perhaps use something like Inset["○", {1, 0}] or Inset["◦", {1, 0}] for your empty points? $\endgroup$ Commented Mar 31, 2019 at 9:31
  • $\begingroup$ How about Epilog -> {Annulus[{0, 0}, {0.45, 0.5}]} $\endgroup$
    – XinBae
    Commented Mar 31, 2019 at 11:51
  • $\begingroup$ Related: Transcritical Bifurcation phase portraits $\endgroup$
    – C. E.
    Commented Mar 31, 2019 at 15:46

2 Answers 2

3
$\begingroup$

Edit

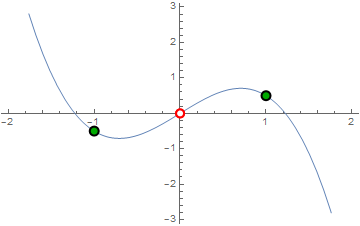
As an example, stable and unstable points are to be plotted.

Clear["Global`*"];

f[x_] := 1.5 x - x^3;
stable = {#, f[#]} & /@ Range[-1, 1, 2];
unstable = {{0, f[0]}};
g = Graphics[{EdgeForm[Thick]
    , FaceForm[Darker@Green], Disk[]}
   ];
Show[Plot[f[x], {x, -2, 2}]
 , ListPlot[{unstable, stable}
  , PlotStyle -> {Red, Black}
  , PlotMarkers -> {{"OpenMarkers", 8}, {g, 12}}
  ]
 , Method -> {"AxesInFront" -> False}
 ]

enter image description here

Original

f[x_] := 1.5 x - x^3;
unstable = {#, f[#]} & /@ Range[-1, 1];
Show[
 Plot[f[x], {x, -2, 2}]
 , ListPlot[unstable
  , PlotStyle -> Black
  , PlotMarkers -> {"OpenMarkers", 8}
  ]
 , Method -> {"AxesInFront" -> False}
 ]

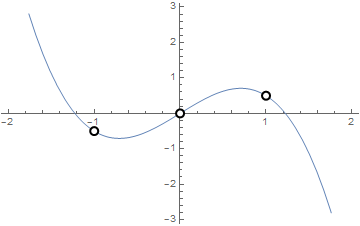
showing discontinuities on plot

$\endgroup$
5
$\begingroup$

We can do what I did in my answer to the question Transcritical Bifurcation phase portraits, which was to use Inset:

unstable = {White, Disk[], Black, Thick, Circle[]};
Plot[
 1.5 x - x^3,
 {x, -2, 2},
 Epilog -> Inset[
   Graphics[unstable],
   {0, 0},
   {0, 0},
   Scaled[{0.05, 0.05}]
   ]]

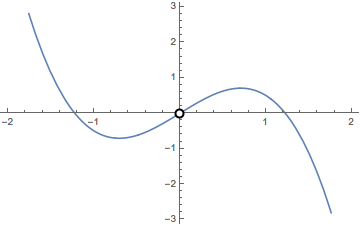
Mathematica graphics

In my other answer, I'm also showing how to draw stable and half-stable markers.

$\endgroup$
4
  • $\begingroup$ Also unstable = {White, EdgeForm[Directive[Thick, Black]], Disk[]} $\endgroup$
    – Michael E2
    Commented Mar 31, 2019 at 17:46
  • $\begingroup$ My only problem with this solution is that the face color of the circle is not transparent $\endgroup$
    – jarhead
    Commented Apr 1, 2019 at 9:45
  • $\begingroup$ @jarhead It shouldn't be too difficult to figure out how to change that, just look at the graphics directive {White, Disk[], Black, Thick, Circle[]} and take a guess at what you need to do in order to remove the white. $\endgroup$
    – C. E.
    Commented Apr 1, 2019 at 9:49
  • $\begingroup$ @C.E, add it to your answer and I'll accept $\endgroup$
    – jarhead
    Commented Apr 1, 2019 at 17:46

Your Answer

By clicking “Post Your Answer”, you agree to our terms of service and acknowledge you have read our privacy policy.

Not the answer you're looking for? Browse other questions tagged or ask your own question.