1
$\begingroup$

The answer from this question helped me use Euler's method. It worked for a simple function, but when the function is more complicated, I get an empty plot. This is my function:

$y'=-\frac{3*(3*sin^2(t)-3*(y-1)^{1.5})*y^2}{pi*(1.6)^2}$

And this is the code:

Clear[x];
x = x /. First[
    NDSolve[{x'[t] == 
    -(3*(3*Sin[t]^2 - 3*((x[t] - 1)^1.5))*(x[t]^2))/(Pi*(1.6)^2), x[0] == 0.8},
    x, {t, 0, 10}, StartingStepSize -> 0.5, 
    Method -> {"FixedStep", Method -> "ExplicitEuler"}]];
grid = Table[{t, x[t]}, {t, 0, 10, 0.5}]
ListLinePlot[grid]

What am I doing wrong?

$\endgroup$

1 Answer 1

3
$\begingroup$

Side note - do not assign x = x/.First[NDSolve[...x[t]...]] - even though you use Clear[x] - it is just bad practice. Keep unknown functions - unknown and keep solutions - solutions.

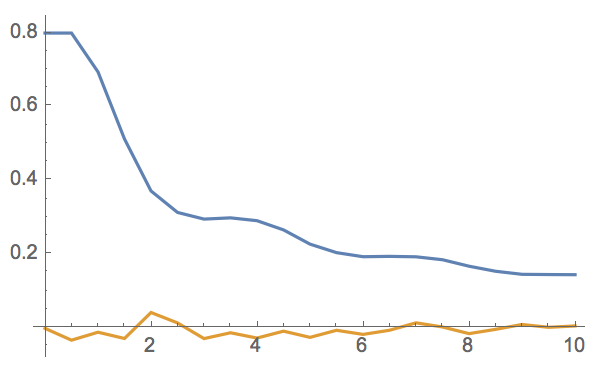
You got some complex value noise. Decrease StartingStepSize -> 1/2 and it will get better. Also use 1/2 instead of 0.5, etc., - just in case to keep higher precision.

sol = x /. 
   First[NDSolve[{x'[
        t] == -(3 (3 Sin[t]^2 - 
             3 ((x[t] - 1)^(3/2)))*(x[t]^2))/(Pi*(16/10)^2), 
      x[0] == 8/10}, x, {t, 0, 10}, StartingStepSize -> 1/2, 
     Method -> {"FixedStep", Method -> "ExplicitEuler"}]];
gridR = Table[{t, Re@sol[t]}, {t, 0, 10, 0.5}];
gridI = Table[{t, Im@sol[t]}, {t, 0, 10, 0.5}];
ListLinePlot[{gridR, gridI}]

enter image description here

$\endgroup$
1
  • $\begingroup$ It works! Thank you very much $\endgroup$ Commented Mar 21, 2014 at 21:16

Your Answer

By clicking “Post Your Answer”, you agree to our terms of service and acknowledge you have read our privacy policy.

Not the answer you're looking for? Browse other questions tagged or ask your own question.