0
$\begingroup$

Suppose I have the following code and I want to show them in the same picture.

figure1 = Plot[x, {x,0,1}];

figure2 = Plot[2x, {x,0,1}, Epilog->Circle[]];

(* * some missing line* *)
(* when this line is uncommented, it removes epilog in figure 2 *)

figure3 = Plot[3x, {x,0,1}, Epilog->Triangle[]];

figure4 = Plot[4x, {x,0,1}, Epilog->Line[{{0, 0}, {1, 1}}]];

Show[figure1, figure2, figure3, figure4]

1.I want to put all plot options outside Show[], as this facilitates commenting/uncommenting part of the code for various uses. But Show only fully respects the 1st argument. How to keep all plot options in each of these figures intact?

2.How to fill that missing line?

$\endgroup$
2
  • 1
    $\begingroup$ You can't really add to an existing plot (at least not using standard methods) once it is made (like you can in Matlab, where one can append to a plot using the hold on command). In Mathematica you have to generate the whole thing all at once or combine different plots using Show for example. Also you can add to a plot using Epilog command. But this has to be made at the time the initial plot is created. Not afterwords. $\endgroup$
    – Nasser
    Commented Mar 12, 2023 at 14:31
  • 3
    $\begingroup$ Use Show. It can be nested as many times as you want: Plot[x, {x, 0, 1}] then Show[%, Epilog -> Triangle[]] then Show[%, Graphics[{Transparent, EdgeForm[Red], Disk[]}]] and so on. Also, read the tutorial about Combining Plots or Combining Graphics. $\endgroup$
    – Domen
    Commented Mar 12, 2023 at 14:44

3 Answers 3

2
$\begingroup$

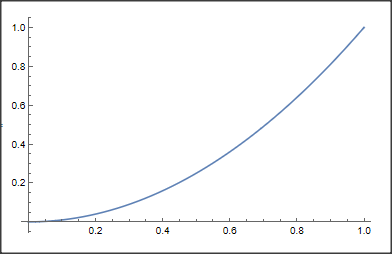
First we create the "preceding" plot:

pl1 = Plot[x^2, {x, 0, 1}]

enter image description here

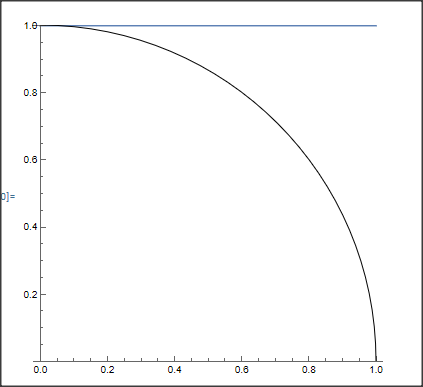
Now, to add a line we can simply plot a line. And the epilog can be added to this second plot. For an example, I choose a horizontal line and for the epilog a circle:

pl2 = Plot[1, {x, 0, 1}, Epilog -> Circle[], AspectRatio -> Automatic,

PlotRange -> {0, 1}]

enter image description here

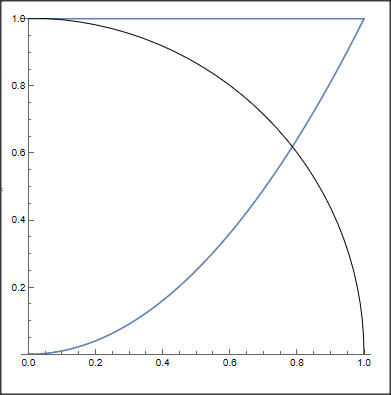
To show everything together we may use "Show". However, as options that appear first override options that appear later, we must specify plot2 first:

Show[pl2, pl1]

enter image description here

Addendum

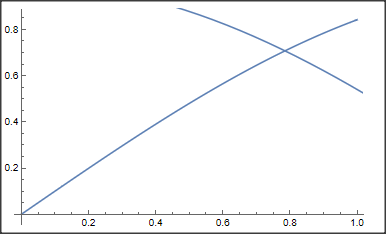
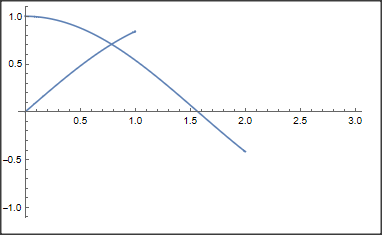
Concerning options, if there are different values for some options, the first one is taken. In addition, options can be overwritten in Show.

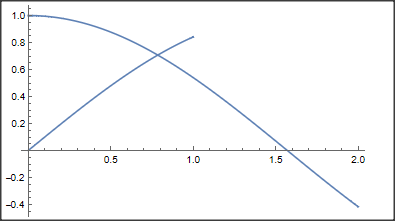
To give an example for different option values (here PlotRange) in Show:

Show[Plot[Sin[x], {x, 0, 1}], Plot[Cos[x], {x, 0, 2}]]
Show[Plot[Cos[x], {x, 0, 2}], Plot[Sin[x], {x, 0, 1}]]
Show[Plot[Cos[x], {x, 0, 2}], Plot[Sin[x], {x, 0, 1}], 
 PlotRange -> {{0, 3}, {-1, 1}}]

enter image description here

enter image description here

enter image description here

$\endgroup$
11
  • $\begingroup$ how to overcome this difficulty of only the first argument in 'show' being kept fully and what if I have multiple figures and I want to keep them all intact? $\endgroup$
    – feynman
    Commented Mar 13, 2023 at 8:57
  • $\begingroup$ By default, the first option is taken if conflicting options appear. However, You may override any option by specifying options in "Show" $\endgroup$ Commented Mar 13, 2023 at 13:58
  • $\begingroup$ thanks, how to specify options in "Show" when wanting to keep all settings of a and b in Show[a,b]? That is, not to lose anything that'll appear when a and b are called separately. $\endgroup$
    – feynman
    Commented Mar 13, 2023 at 15:24
  • $\begingroup$ I added an example in my answer $\endgroup$ Commented Mar 13, 2023 at 16:01
  • $\begingroup$ Thanks for the addendum. I have a specific question of losing an epilog in show. For example, there's different epilogs is in b and c which will be lost in show[a,b,c]. $\endgroup$
    – feynman
    Commented Mar 14, 2023 at 8:07
1
$\begingroup$

Rather than putting these features all together, this facilitates commenting/uncommenting part of the code for various uses.

You can't really add to an existing plot (at least not using standard methods) once it is made (like you can in Matlab, where one can append to a plot using the hold on command). In Mathematica you have to generate the whole thing all at once again or combine different plots using Show for example. Also you can add to a plot using Epilog command. But this has to be made at the time the initial plot is created. Not afterwords.

But you can simply do this to meet your need of adding comments after each plot is updated

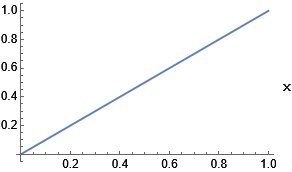
p1 = Plot[x, {x, 0, 1}, PlotLegends -> "x"]

Mathematica graphics

(*And now we can add plot of sin(x) to the above*)

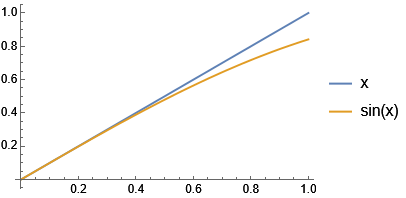
p2 = Plot[{x, Sin[x]}, {x, 0, 1}, PlotLegends -> {"x", "sin(x)"}]

Mathematica graphics

(*And now we can add plot of tan(x) to the above*)

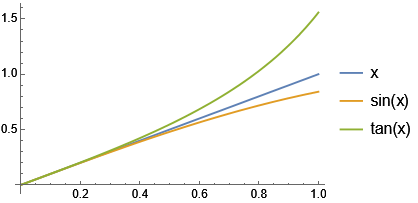
p2 = Plot[{x, Sin[x], Tan[x]}, {x, 0, 1}, PlotLegends -> {"x", "sin(x)", "tan(x)"}]

Mathematica graphics

And so on. I do not see any difference in the above vs. Matlab's hold on where one add a new plot to existing figure. In Mathematica you just have to replot everything at once. That is all.

Another option is to use Show. Generate each separate plot on its own, then add each to the other using Show. Like this

 p1=Plot[x,....]
 p2=Plot[Sin[x],....]
 p3=Plot[Tan[x],....]

 Show[p1]
 Show[p1,p2]
 Show[p1,p2,p3]

Show is used to combine different plots. So you now have two options to use to do what Matlab's hold on does.

$\endgroup$
6
  • 1
    $\begingroup$ I find your first sentence ("You can't really add to an existing plot ...") perhaps a bit misleading. Isn't Show[p1, Epilog -> ...] doing exactly this, namely adding stuff to an existing plot? $\endgroup$
    – Domen
    Commented Mar 12, 2023 at 16:44
  • 1
    $\begingroup$ @Domen I do not consider Show[p1, Epilog -> ...] as adding to existing plot. It is using Show. What I mean by adding to existing plot, is to add to /modify p1 itself by addinbg to it directly. Just like Matlab's hold on does which is append to an existing figure. Any way, may be it is semantics and depend show you look at it. $\endgroup$
    – Nasser
    Commented Mar 12, 2023 at 16:48
  • 1
    $\begingroup$ Well, but that is a more general property of Mathematica-like programming, which mostly works on "immutable" objects, not something peculiar of plotting. And it is also not true that this is not possible, look: AppendTo[p1, Epilog -> Disk[]] works just fine, and it actually modifies p1. $\endgroup$
    – Domen
    Commented Mar 12, 2023 at 17:18
  • $\begingroup$ @Nasser it seems that the sequence in 'Show' matters, that is, Show[a,b] is different from Show[b,a]. So should we say that in Show[a,b] a is added to b rather than the opposite? $\endgroup$
    – feynman
    Commented Mar 13, 2023 at 2:03
  • 1
    $\begingroup$ @feynman The only difference is that Show uses the first one for the default settings. i,e all the plot options are taken from the first one, but this is easy to override, and you can also make it so there is one common plot options. See help Show uses the options from the first graphic: For example, if the first plot had PlotRange, that is the one used for all plots. And so on. That is why when you change the order, things can look different if each plot used different PlotRange. But again, you can override all of this. $\endgroup$
    – Nasser
    Commented Mar 13, 2023 at 2:07
1
$\begingroup$

As have been mentioned multiple times, only the first occurence of Epilog will be preserved when using Show. You can, however, collect all Epilogs together and combine them into a single list.

combinePlots[figs_] := 
 Show[figs, Epilog -> Cases[figs, HoldPattern[Epilog -> e_] :> e, All]]

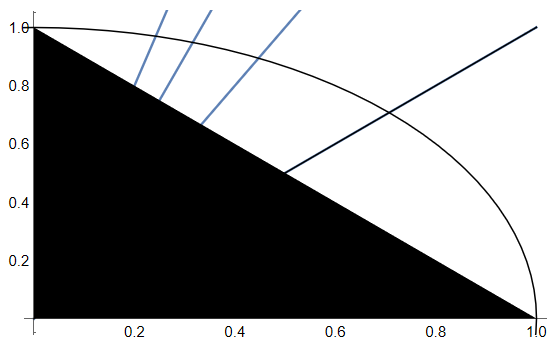
combinePlots[{figure1, figure2, figure3, figure4}]

Plots

$\endgroup$

Your Answer

By clicking “Post Your Answer”, you agree to our terms of service and acknowledge you have read our privacy policy.

Not the answer you're looking for? Browse other questions tagged or ask your own question.