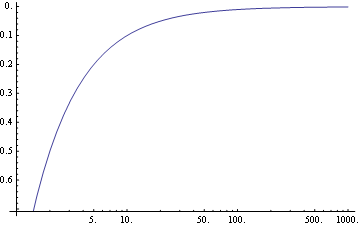
I am trying to make a chart where the x-axis has a log scale and the y-axis is in reverse order. I tried to use LogLinearPlot, and I tried to combine it with ScalingFunctions. My code was:
LogLinearPlot[1/x, {x, 1, 1000}, ScalingFunctions->"Reverse"]
But this failed. So I tried using Plot and ScalingFunctions:
Plot[1/x, {x, 1, 1000}, ScalingFunctions -> {"Log", "Reverse"}]
That gave me an error as well. I noticed that ScalingFunctions works just fine when applied to the y-axis, as in:
Plot[1/x, {x, 1, 1000}, ScalingFunctions -> "Log"]
Plot[1/x, {x, 1, 1000}, ScalingFunctions->"Reverse"]
However, when I apply ScalingFunctions to the x-axis, it will give an error; for example:
Plot[1/x, {x, 1, 1000}, ScalingFunctions -> {"Log", Identity}]
Can anyone tell me what to do to get a reversed y-axis and a logarithmic x-axis at the same time?

