1
$\begingroup$

I have the following code for solving differential equations:

DSolve[{si1''[x] - 6/(270000*0.054) (si1[x] + se1[x]) == 0, 
si1''[x] - se1''[x] == -(6/(7000*4)) se1[x], 
si2''[x] - 6/(270000*0.054) se2[x] == 0, 
si2''[x] - se2''[x] == -(6/(7000*4)) se2[x], si1'[0] == 0, 
si1'[0] == se1'[0], si2'[1000] == se2'[1000], 
si1'[1000 - a] - se1'[1000 - a] == si2'[1000 - a] - se2'[1000 - a], 
se1'[1000 - a] == se2'[1000 - a], si1[1000 - a] == si2[1000 - a], 
se1[1000 - a] == se2[1000 - a], si1[1000 - a] == 0.2}, {si1, si2, 
se1, se2}, x]

Then, I would like to evaluate the value of the parameter "a" such that se2[1000]=0.2. How can I solve this problem? Thanks

$\endgroup$

1 Answer 1

3
$\begingroup$
Clear["Global`*"]

Rationalize equations to get exact solution and enable subsequent selection and control of desired precision.

eqns = {si1''[x] - 6/(270*54) (si1[x] + se1[x]) == 0, 
   si1''[x] - se1''[x] == -(6/(7000*4)) se1[x], 
   si2''[x] - 6/(270*54) se2[x] == 0, 
   si2''[x] - se2''[x] == -(6/(7000*4)) se2[x], si1'[0] == 0, 
   si1'[0] == se1'[0], si2'[1000] == se2'[1000], 
   si1'[1000 - a] - se1'[1000 - a] == si2'[1000 - a] - se2'[1000 - a], 
   se1'[1000 - a] == se2'[1000 - a], si1[1000 - a] == si2[1000 - a], 
   se1[1000 - a] == se2[1000 - a], si1[1000 - a] == 1/5};

sol = DSolve[eqns, {si1, si2, se1, se2}, x][[1]];

eqn2 = se2[1000] == 1/5 /. sol // Simplify // N[#, 20] &;

Use FindRoot[lhs == rhs, {x, x0, x1}] to search for a solution using x0 and x1 as the first two values of x, and avoid the use of derivatives.

sola = FindRoot[eqn2, {a, 5, 10}, WorkingPrecision -> 15]

{* {a -> 38.9567170435138} *)

Verifying that sola satisfies eqn2

se2[1000] == 1/5 /. sol /. sola

(* True *)

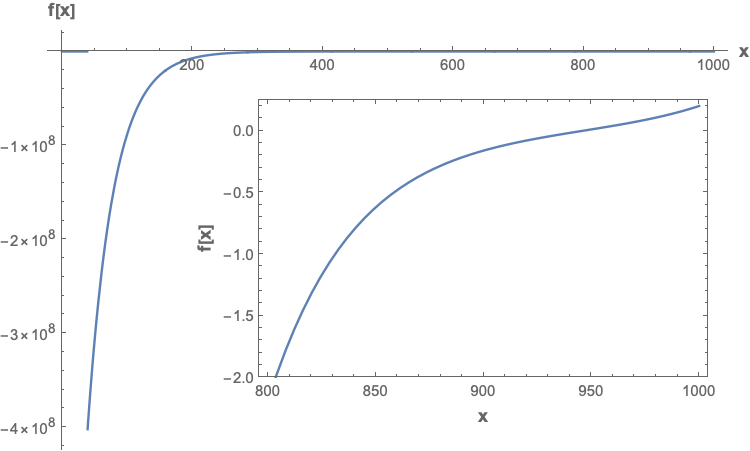
EDIT Plot requested in comment

f[x_] := Piecewise[
     {{se1[x], 0 < x < a}, {se2[x], a < x < 1000}}] /.
    sol /. sola;

Plot[f[x], {x, 0, 1000},
 PlotRange -> All,
 Exclusions -> {x == a /. sola},
 AxesLabel -> (Style[#, 12, Bold] &) /@ {"x", "f[x]"},
 ImageSize -> 500,
 Epilog -> Inset[
   Plot[f[x], {x, 800, 1000},
    Frame -> True, Axes -> False,
    PlotRange -> {-2, 0.25},
    FrameLabel -> (Style[#, 12, Bold] &) /@ {"x", "f[x]"}],
   Scaled[{0.6, 0.45}], Automatic, 800]]
enter image description here

$\endgroup$
3
  • $\begingroup$ Thanks. My further question is: I would like to plot a piecewise function with se1 for 0<x<sola and se2 for sola<x<1000. $\endgroup$
    – Gae P
    Commented Feb 11, 2019 at 21:40
  • $\begingroup$ Thanks! I change the boundary conditions of the plot: se1 for 0<x<1000-a and se2 for 1000-a<x<1000. If I plot a similar piecewise function for si1 and si2 I have troubles for a which tends to 1000. $\endgroup$
    – Gae P
    Commented Feb 12, 2019 at 10:08
  • $\begingroup$ Rather than changing the question, ask a new question. Post the code you are using and explain what problems you are unable to resolve. $\endgroup$
    – Bob Hanlon
    Commented Feb 12, 2019 at 13:08

Your Answer

By clicking “Post Your Answer”, you agree to our terms of service and acknowledge you have read our privacy policy.

Not the answer you're looking for? Browse other questions tagged or ask your own question.