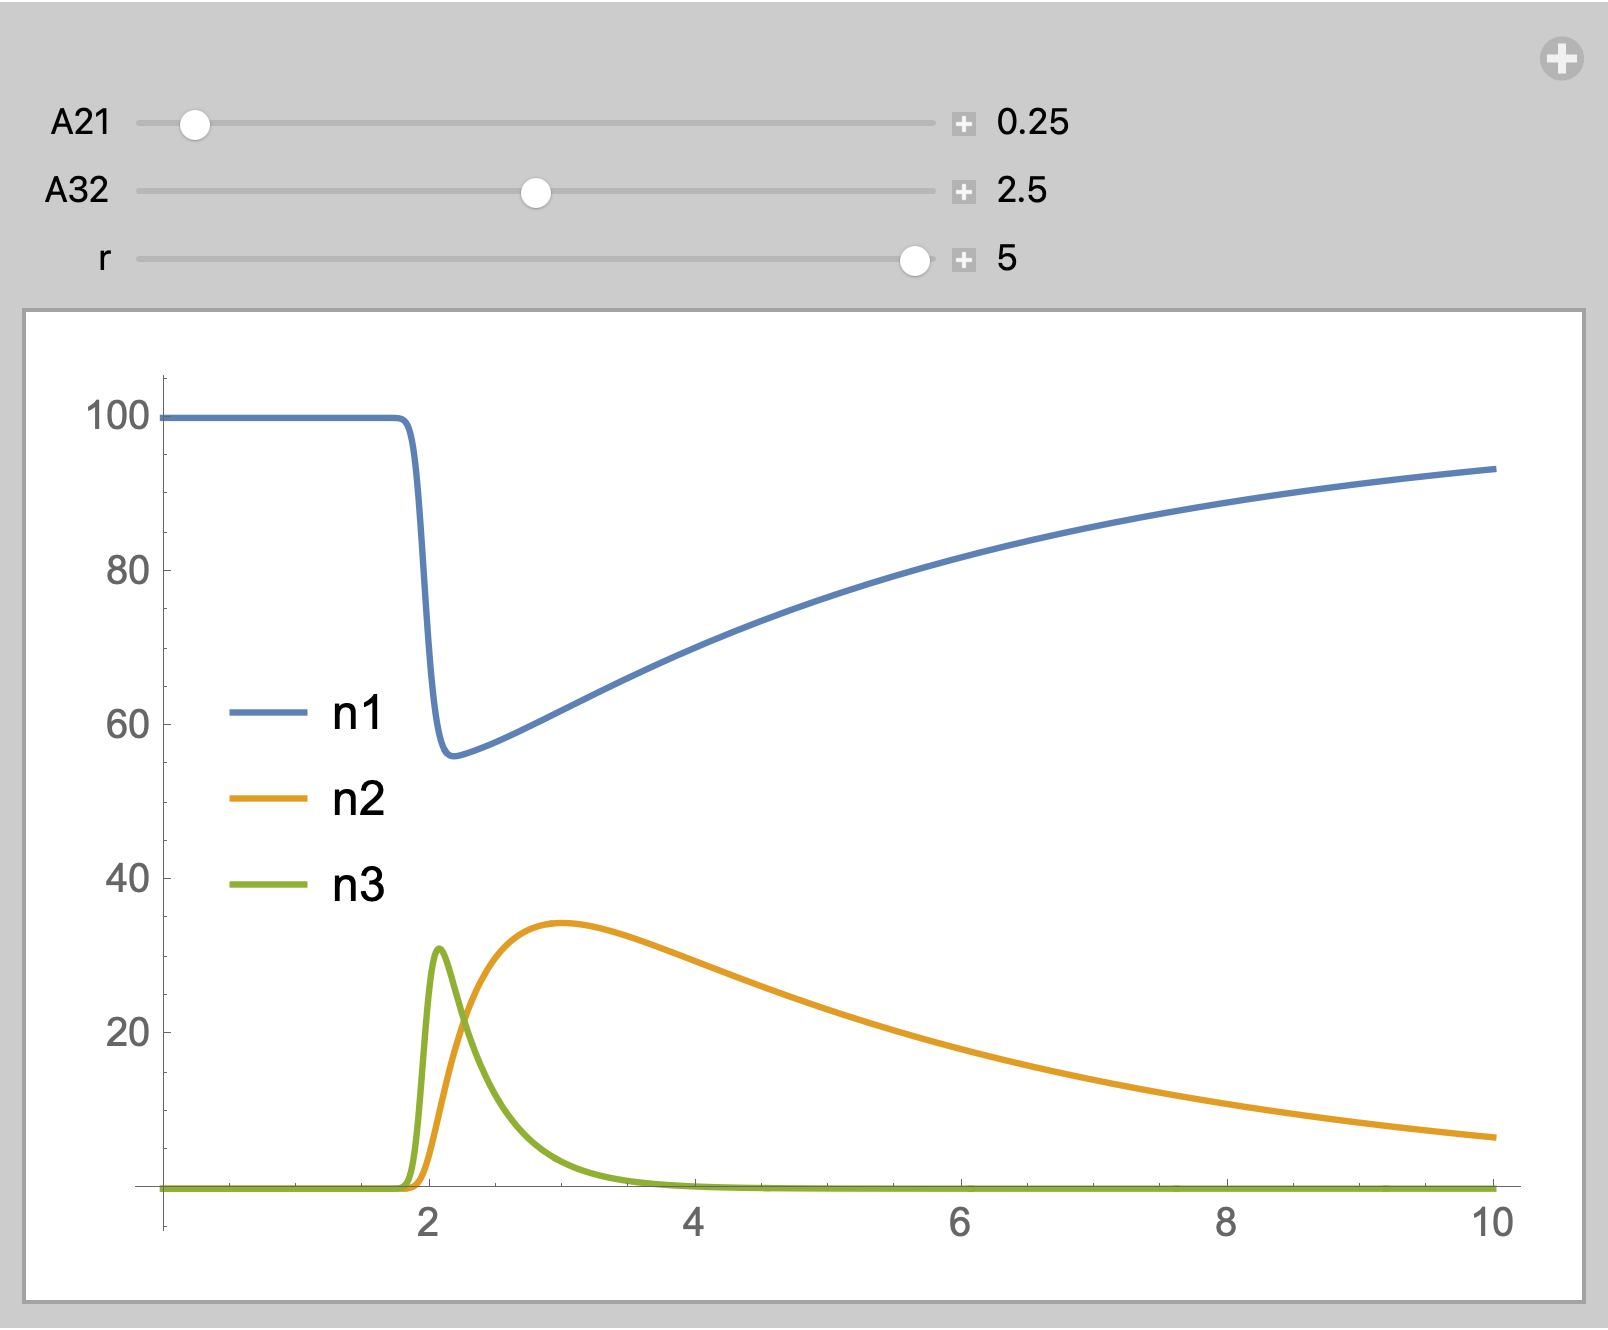
Use ParametricNDSolve
eqns = {
   n1'[t] == A21*n2[t] + (r*Exp[-(10 (t - 2))^2])*(n3[t] - n1[t]),
   n2'[t] == A32*n3[t] - A21*n2[t],
   n3'[t] == -A32*n3[t] - (r*Exp[-(10 (t - 2))^2]) (n3[t] - n1[t]),
   n1[0] == 100, n2[0] == 0, n3[0] == 0};

Solution =
 ParametricNDSolve[eqns, {n2, n1, n3}, {t, 0, 10}, {A21, A32, r}]

Manipulate[
 Plot[Evaluate[
   (#[A21, A32, r] /. Solution)[t] & /@
    {n1, n2, n3}], {t, 0, 10},
  PlotPoints -> 50,
  MaxRecursion -> 5,
  WorkingPrecision -> 15,
  PlotLegends -> Placed[{n1, n2, n3}, {.125, .5}]],
 {{A21, 0.25}, 0, 5, 0.1,
  Appearance -> "Labeled"},
 {{A32, 2.5}, 0, 5, 0.1,
  Appearance -> "Labeled"},
 {{r, 5}, 0, 5, 0.1,
  Appearance -> "Labeled"}]

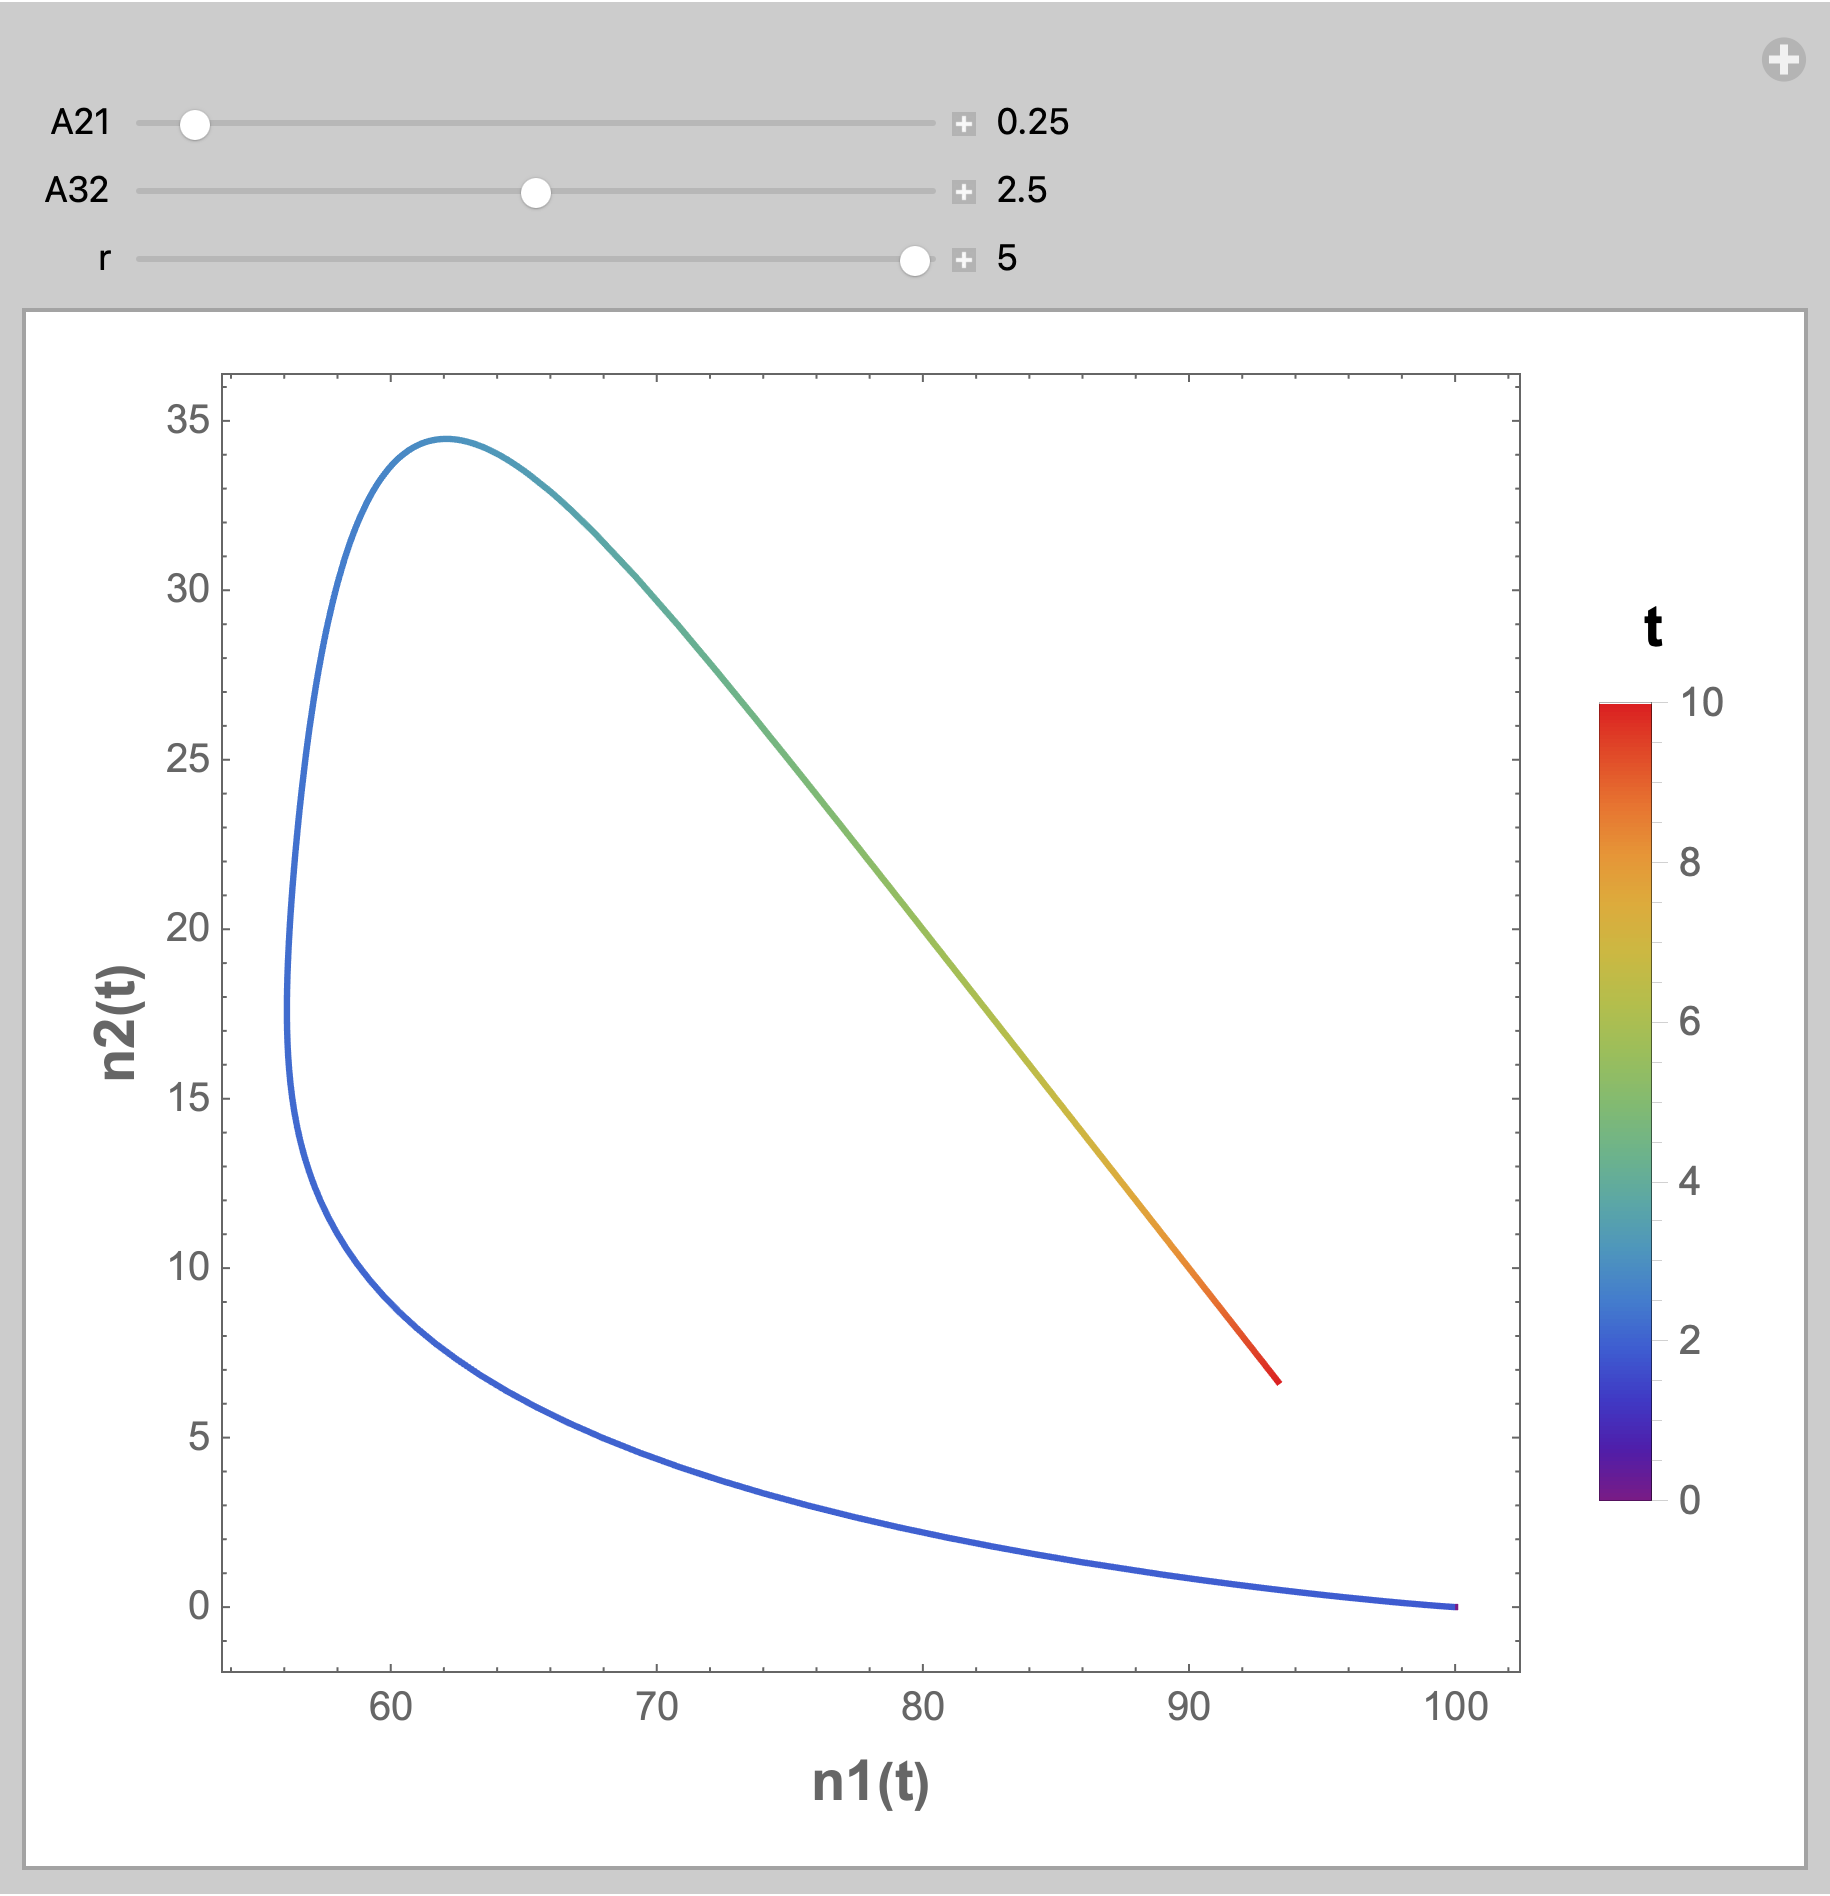
EDIT: To plot one function against another use ParametricPlot
Manipulate[
 ParametricPlot[Evaluate[
   (#[A21, A32, r] /. Solution)[t] & /@ {n1, n2}],
  {t, 0, 10},
  PlotPoints -> 50,
  MaxRecursion -> 5,
  WorkingPrecision -> 15,
  Frame -> True,
  FrameLabel -> (Style[#, 14, Bold] & /@
     {"n1(t)", "n2(t)"}),
  ColorFunction -> Function[{n1, n2, t},
    ColorData["Rainbow"][t]],
  PlotLegends -> BarLegend[{"Rainbow", {0, 10}},
    LegendLabel -> Style["t", 14, Bold]],
  AspectRatio -> 1],
 {{A21, 0.25}, 0, 5, 0.1, Appearance -> "Labeled"},
 {{A32, 2.5}, 0, 5, 0.1, Appearance -> "Labeled"},
 {{r, 5}, 0, 5, 0.1, Appearance -> "Labeled"}]


DSolvereturns unevaluated, when it cannot obtain a solution. Provide values for the constants and rryNDSolve.$\endgroup$