24
$\begingroup$

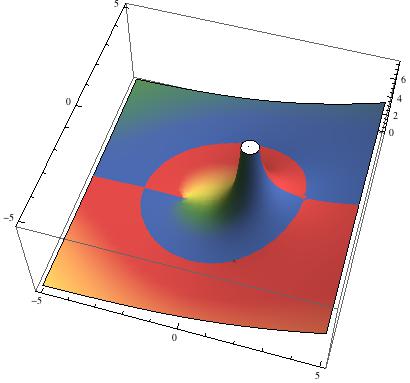
I have a function $f:\mathbb{C}\rightarrow\mathbb{C}$ which I would like to visualize by by plotting $|f|$ with Plot3D using $\operatorname{Arg}f$ as the ColorFunction.

I use

DensityPlot[Arg[f[a + I b]], {a, -5, 5}, {b, -5, 5}, PlotPoints -> 35,
            WorkingPrecision -> 50, ColorFunction -> "DarkRainbow"]

and get the following:
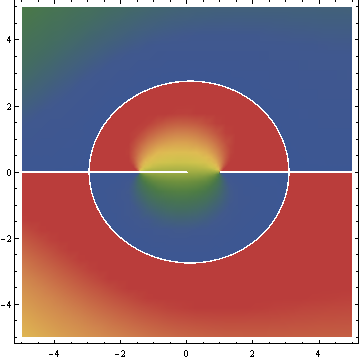
nice

which looks pretty nice. However then when I use

Plot3D[Abs[f[a + I b]], {a, -5, 5}, {b, -5, 5}, PlotPoints -> 35, 
      WorkingPrecision -> 50, 
      ColorFunction -> (ColorData[{"DarkRainbow", {-\[Pi], \[Pi]}}][Arg[f[#1 + I #2]]] &), 
      ColorFunctionScaling -> False, 
      PerformanceGoal -> "Quality", Mesh -> None]

I get
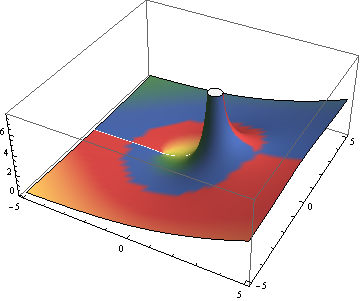
awful

The quality of $\operatorname{Arg}f$ was fine in the DensityPlot using the same quality parameters, but it's awful when I make it a ColorFunction. I suppose this is because the surface mesh is made from $|f|$ in the Plot3D and not from $\operatorname{Arg}f$ as it was in the DensityPlot, and $|f|$ isn't changing very much around the important parts of $\operatorname{Arg}f$ which is why it looks so choppy and noticable.

So, how do I fix this? Is there a way to give the ColorFunction more PlotPoints than the actual surface, or perhaps a different mesh? If possible I want to avoid just increasing PlotPoints for the overall plot, as I am happy with the quality of $|f|$ here, and it can be very slow to render as it is.

$\endgroup$
2
  • $\begingroup$ You don't give f. Is it intentional ? $\endgroup$
    – andre314
    Commented Feb 5, 2013 at 21:07
  • $\begingroup$ Well, here f[z_] := BesselI[0, 2 Sqrt[z]]/(1 - z), but I plan to do this with a lot of functions so I am really interested in a general method. $\endgroup$ Commented Feb 5, 2013 at 21:09

3 Answers 3

21
$\begingroup$

There is indeed an alternative which you might should consider. You almost got it yourself by the given analysis of the situation in your question. While Plot3D does only care of a good resolution of the function you plot and not the function you use for coloring, DensityPlot uses your color function from the beginning and tries to resolve this as best as possible.

Therefore, one possible way is to use the DensityPlot image as texture on your surface.

f[z_] := BesselI[0, 2 Sqrt[z]]/(1 - z)
img =
 Rasterize[
  DensityPlot[Arg[f[a + I b]], {a, -5, 5}, {b, -5, 5}, 
   PlotPoints -> 30, 
   ColorFunction -> (ColorData[{"DarkRainbow", {-Pi, Pi}}][#] &),
   ColorFunctionScaling -> False, Frame -> False, 
   PlotRangePadding -> 0, ImageMargins -> 0], "Image", 
  RasterSize -> 512];

Plot3D[Abs[f[a + I b]], {a, -5, 5}, {b, -5, 5}, 
 PlotStyle -> Texture[img], Mesh -> None, Lighting -> "Neutral"]

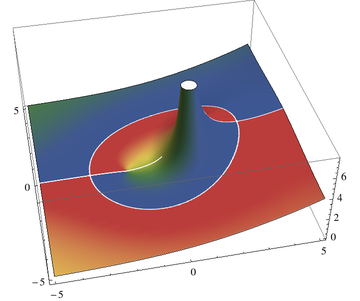
Mathematica graphics

$\endgroup$
1
  • $\begingroup$ Perfect, exactly what I was looking for. Thanks. $\endgroup$ Commented Feb 6, 2013 at 13:20
21
+100
$\begingroup$

Similar to halirutans answer you can let DensityPlot determine the "good points", and then ListPlot3D those:

ptsdp = Reap[
    DensityPlot[Arg[f[a + I b]], {a, -5, 5}, {b, -5, 5}, 
     PlotPoints -> 25, ColorFunction -> "DarkRainbow", 
     EvaluationMonitor :> Sow[{a, b}]]][[-1, 1]];
ListPlot3D[({#[[1]], #[[2]], Abs@f[Complex @@ #]}) & /@ ptsdp,
  ColorFunction -> (ColorData[{"DarkRainbow", {-\[Pi], \[Pi]}}][Arg[f[#1 + I #2]]] &),
  ColorFunctionScaling -> False]

This generally has the drawback that the 3D sample points wont get refined further when need be. One possibility would be to Join the points with the ones Plot3D picks.

I was going to use this trick but couldn't figure out the syntax for Plot3D

$\endgroup$
1
  • 1
    $\begingroup$ Needs more votes! The fact that you don't have to Rasterize and Texture is, IMO, a major advantage of this approach. $\endgroup$ Commented Feb 8, 2013 at 0:52
7
$\begingroup$

You can add Arg[f] explicitly in the function to plot with ridiculously small coefficient. Then Mathematica will render points as you wish. Also it is good idea to put ExclusionStyle->Automatic to get rid of white lines. Below is your code with these corrections:

Block[{f = BesselI[0, 2 Sqrt[#]]/(1 - #) &},
  Plot3D[Abs[f[a + I b]] + 10^-50 Arg[f[a + I b]] // Evaluate, {a, -5, 
  5}, {b, -5, 5}, PlotPoints -> 35, 
  ColorFunction -> (ColorData[{"DarkRainbow", {-\[Pi], \[Pi]}}][
  Arg[f[#1 + I #2]]] &), ColorFunctionScaling -> False,  
  Mesh -> None, 
  ExclusionsStyle -> Automatic]
]

I also added Evaluate command, then result is plotted slightly faster. No need to increase WorkingPrecision or set up Performance goal. The output is:

enter image description here

There is a little flaw behind the peak, at the cross of blue and red regions. It is cured by increasing the number of PlotPoints, the cost is time of plotting.

$\endgroup$
1
  • $\begingroup$ Hey, that's a pretty smart trick. :) +1 $\endgroup$ Commented Aug 5, 2013 at 4:36

Your Answer

By clicking “Post Your Answer”, you agree to our terms of service and acknowledge you have read our privacy policy.

Not the answer you're looking for? Browse other questions tagged or ask your own question.