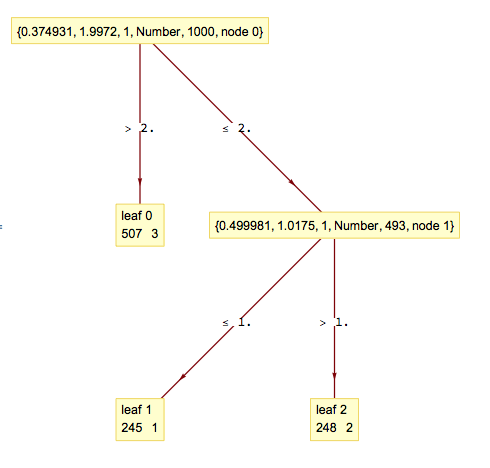
Here is one way to visualize/interpret Classify's tree structure from Henrik Schumacher's answer.
SeedRandom[432]
fn[n_] := Which[n < 1, 1, 1 <= n < 2, 2, 2 <= n, 3];
data = Table[(r = RandomReal[{0, 4}]; r -> fn[r]), {i, 1, 1000}];
c = Classify[data, Method -> "DecisionTree"];
tree = c[[1, "Model", "Tree"]];
fromRawArray[a_RawArray] := Developer`FromRawArray[a];
fromRawArray[a_] := a;
Map[Normal, fromRawArray /@ tree[[1]]]
(* <|"FeatureIndices" -> {1, 1},
"NumericalThresholds" -> {-0.894867, -0.0252423},
"NominalSplits" -> {}, "Children" -> {{-2, -3}, {1, -1}},
"LeafValues" -> {{1, 1, 508}, {246, 1, 1}, {1, 249, 1}},
"RootIndex" -> 2, "NominalDimension" -> 0|> *)
Import["https://raw.githubusercontent.com/antononcube/MathematicaForPrediction/master/AVCDecisionTreeForest.m"]
dtree = BuildDecisionTree[List @@@ data]
(* {{0.374931, 1.9972, 1, Number,
1000}, {{0.499981, 1.0175, 1, Number,
493}, {{{245, 1}}}, {{{248, 2}}}}, {{{507, 3}}}} *)
LayeredGraphPlot[DecisionTreeToRules[dtree],
VertexLabeling -> True]

There is a discrepancy of 1 in the obtained values, but otherwise the second tree seems to approximate Classify's one well. The splitting thresholds of Classify's tree a most likely obtained over the data being transformed with some embedding/hashing/normalization.


trainSet. $\endgroup$fn[n_] := Which[n < 1, 1, 1 <= n < 2, 2, 2 <= n, 3];. Data generated asdata = Table[(r = RandomReal[{0, 4}]; r -> fn[r, 1, 2, 3]), {i, 1, 1000}];and classifying usingc = Classify[data, Method -> "DecisionTree"];then trying to visuallize usingc[[1, "Model", "Tree"]]$\endgroup$See an output like this for the question<|FeatureIndices->RawArray[Integer16,<2>],NumericalThresholds->RawArray[Real32,<2>],NominalSplits->{},Children->RawArray[Integer16,<2,2>],LeafValues->RawArray[UnsignedInteger16,<3,3>],RootIndex->2,NominalDimension->0|>` withclassifier[[1, "Model", "Tree"]]. Can be improved further? $\endgroup$