17
$\begingroup$

I would like to use Mathematica to help me simplify a given Binary Decision Diagram (i.e. pick the optimal variable ordering). I don't seem to find anything at all on the topic, although it is something everyone with a little CS background knows very well.

Given MMA's ability of dealing with graphs and boolean functions the task seems feasible, but I wouldn't want to waste a long time to solve a problem that is already solved. Is anybody aware of MMA resources on the matter?

$\endgroup$
8
  • 1
    $\begingroup$ Yes, those expression are really easy for MMA, but how would I find the optimal variable order by using them? $\endgroup$
    – Ziofil
    Commented Sep 7, 2014 at 3:38
  • 1
    $\begingroup$ Please look at BooleanConvert with "BDT" (Boolean decision tree) and "IF" (If and constants) forms. $\endgroup$
    – kirma
    Commented Sep 7, 2014 at 10:26
  • 1
    $\begingroup$ @kirma BooleanConvert can make a Boolean Decision Tree, but not the Binary Decision Diagram the OP asks for. The latter is an optimized form of the BDT. $\endgroup$ Commented Sep 7, 2014 at 13:25
  • 1
    $\begingroup$ The Wikipedia article has various external links to existing Java and C libraries. I assume you could link those in Mathematica. $\endgroup$ Commented Sep 7, 2014 at 13:39
  • 1
    $\begingroup$ @SjoerdC.deVries I think MMA has internal functions to generate BDD, the evidence can be shown by InputForm[BooleanFunction[30]], which gives BooleanFunction["BDD" -> {-3, 0, 2, -2, 1, 1, 3, 2, 1, -1}]. The question is how to decode this list. $\endgroup$
    – Silvia
    Commented Nov 18, 2015 at 3:51

3 Answers 3

11
$\begingroup$

This answer is a modification of my answer given in the discussion Creating Identification/Classification trees.

With this solution I am trying to achieve the simplification by using the impurity function applied to the data (the truth table in this case).

Make the truth table from the linked Wikipedia article (Binary Decision Diagram):

truthTable = {{0, 0, 0, 1}, {0, 0, 1, 0}, {0, 1, 0, 0}, {0, 1, 1, 
    1}, {1, 0, 0, 0}, {1, 0, 1, 0}, {1, 1, 0, 1}, {1, 1, 1, 1}};
truthTable = Map[ToString, truthTable, {-1}];
colNames = {"x1", "x2", "x3", "f"};
TableForm[truthTable, TableHeadings -> {None, colNames}]
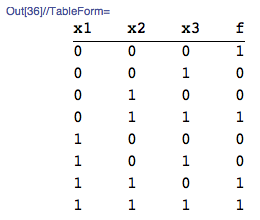
enter image description here

Import the package:

Import["https://raw.githubusercontent.com/antononcube/MathematicaForPrediction/master/AVCDecisionTreeForest.m"]

Build a decision tree:

dtree = BuildDecisionTree[truthTable, "ImpurityFunction" -> "Gini"]

(* {{0.125, "0", 2, Symbol, 
  8}, {{0.125, "0", 1, Symbol, 
   4}, {{0.5, "0", 3, Symbol, 
    2}, {{{1, "1"}}}, {{{1, "0"}}}}, {{{2, "0"}}}}, {{0.125, "0", 1, Symbol, 
   4}, {{0.5, "0", 3, Symbol, 2}, {{{1, "0"}}}, {{{1, "1"}}}}, {{{2, "1"}}}}} *)

The impurity function "Gini" is used by default. Another possible value is "Entropy". Note that to make the decision tree I converted the 0-1 values in the truth table into strings.

Visualize the tree:

trules = dtree // DecisionTreeToRules;
trules = trules /. ({m_, v_, cInd_Integer, s_, n_, id_} :> {m, v, colNames[[cInd]], s, n, id});
LayeredGraphPlot[trules, VertexLabeling -> True]

The last commands produce the plot:
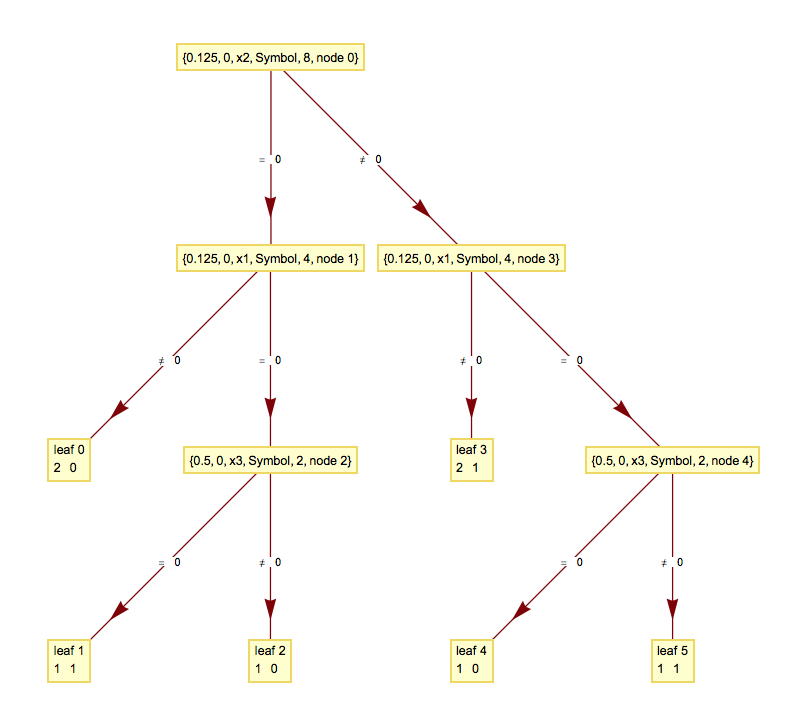
enter image description here

The second row of a leaf shows the corresponding number of records and label.

The tree rules can be manipulated to produce a graph closer to the one in the Wikipedia article, if that is desired.

See these blog posts for application examples, parameters explanations, and tweaking discussions:

Decision trees posts at MathematicaForPrediction at WordPress.

$\endgroup$
9
$\begingroup$

The problem of finding the variable order that minimizes the number of nodes in a given reduced ordered binary decision diagram is NP-hard. So, it is typically not used very much. It is implemented in CUDD as CUDD_REORDER_EXACT.

Rudell's sifting is the algorithm most frequently used. In both a brute force computation of the optimal order, as well as sifting, the elementary step is the same: swapping the levels of two variables. This is the difficult part to implement. The strategy of reordering (sifting vs exact vs something else) is relatively straightforward.

I am aware of BDD libraries implemented in several languages, but not Mathematica.

Note: I assumed that the OP wants to find the optimal variable order. This is different from reducing an ordered BDD (but usually BDDs are made reduced by construction, so, in practice, reduction is never applied). Also, it is different from (syntactic ?) "simplification" of a Boolean formula (e.g., true and false = false). Reduction of a BDD and formula simplification are conceptually similar, though different things.

$\endgroup$
8
$\begingroup$

EDIT: This method really just optimizes, and visualizes binary decision trees, not general binary decision diagrams. I answered a question - sadly not one that was asked! :)

"If and constants" ("IF") form of BooleanConvert seems to be sensitive to order of boolean variables; it always builds the tree starting from the first appearing in the description of a boolean equation.

Let's pick a boolean equation:

bf = BooleanConvert@BooleanFunction[12432, 4][a, b, c, d]

(a && b && ! c) || (! a && b && c && d) || (b && ! c && ! d)

We can convert this to if-and-constants form:

BooleanConvert[bf, "IF"]

If[a, If[b, If[c, False, True], False], If[b, If[c, If[d, True, False], If[d, False, True]], False]]

Here's a function that converts a boolean function to its' if-and-constants form, and visualizes it as a graph:

ClearAll[bddGraph];
bddGraph[bf_] :=
  With[{eq =
    Replace[BooleanConvert[bf, "IF"], If -> List, \[Infinity], Heads -> True]},
  Graph[
   (Labeled[#, Extract[eq, #~Append~1]] & /@
      Position[eq, _List])~Join~(Labeled[#, #] & /@ {True, False}),
   Flatten[{Labeled[# \[DirectedEdge] #~Append~2, True], 
        Labeled[# \[DirectedEdge] #~Append~3, False]} & /@
      Position[eq, _List], 2] /. 
    a_ \[DirectedEdge] b_ :> 
     a \[DirectedEdge] Extract[eq, b] /; BooleanQ[Extract[eq, b]]]]

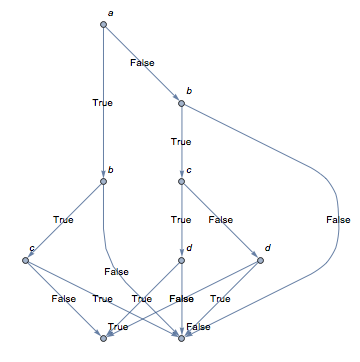
Yes... this is a bit messy. Nonetheless, now we can visualize the decision tree:

bddGraph[bf]

enter image description here

What if we would reorder variables to BooleanConvert and pick the one that produces shortest average path to final decision? This can be done, a bit awkwardly and with brute force, by permuting through all variable orderings, and choosing from weights the "best" one (I can't guarantee my logic is infallible, but it seems to work):

ClearAll[bddMinimize];
bddMinimize[bf_] := 
 First@MaximalBy[(Function[f, 
      BooleanFunction[BooleanTable[f, #]] @@ # & /@ 
       Permutations@BooleanVariables@f][bf]),
   Mean@(2^-Length[#] & /@ 
       Position[BooleanConvert[#, "IF"], x_Symbol /; BooleanQ[x]]) &,
   1]

Let's try it out.

bfm = bddMinimize[bf]

BooleanFunction[< 4 >][{b, a, c, d}]

BooleanConvert[bfm, "IF"]

If[b, If[a, If[c, False, True], If[c, If[d, True, False], If[d, False, True]]], False]

It's different, but is it better? Check out the graph:

bddGraph[bfm]

enter image description here

I think it's a bit better.

$\endgroup$
2
  • $\begingroup$ I'm afraid the result for the Wikipedia example x1 && x2 || x3 && x4 || x5 && x6 || x7 && x8 doesn't look at all as reduced as shown there. I don't think this approach works. $\endgroup$ Commented Sep 7, 2014 at 13:37
  • $\begingroup$ @SjoerdC.deVries Ah, you are correct. BooleanConvert builds trees, not graphs. Building an optimal one like in Wikipedia is beyond reach of this code (whose point is mostly to create graphs where obvious exits are handled first). $\endgroup$
    – kirma
    Commented Sep 7, 2014 at 13:42

Your Answer

By clicking “Post Your Answer”, you agree to our terms of service and acknowledge you have read our privacy policy.

Not the answer you're looking for? Browse other questions tagged or ask your own question.