NSolve[ - 8 a^2 x + 9 x^2 -12 x^3 + 4 x^4 == 0, x];
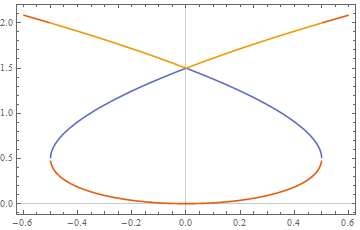
Plot[Evaluate[  x   /.   %  ],    {a, -0.6, 0.6}]
How can I show only positive roots in this plot?
This equation is one of the case of Equation (32) given in this paper.
NSolve[ - 8 a^2 x + 9 x^2 -12 x^3 + 4 x^4 == 0, x];
Plot[Evaluate[ x /. % ], {a, -0.6, 0.6}]
How can I show only positive roots in this plot?
This equation is one of the case of Equation (32) given in this paper.
NSolve is for finding numerical solutions and is not appropriate when there are non-numerical parameters, such as a in your example. Use Solve instead.
If you only need a plot, an alterative approach to solve-and-plot is to plot the implicit equation directly using ContourPlot.
ContourPlot[-8 a^2 x + 9 x^2 - 12 x^3 + 4 x^4 == 0,
 {a, -.6, .6}, {x, -1, 3},
 FrameLabel -> Automatic,
 MaxRecursion -> 4, PlotPoints -> 100,
 RegionFunction -> Function[{a, x}, x > 1*^-16]]
MaxRecursion and PlotPoints are used to increase accuracy. RegionFunction is to eliminate non-positive solutions. Since x == 0 is always a solution, I needed to use a value marginally higher than 0 to define the region and exclude the x == 0 line.
Plot[
 Evaluate[
  x /. NSolve[
    {
     -8 a^2 x + 9 x^2 - 12 x^3 + 4 x^4 == 0
     , x > 0
     }
    , x
    , Reals
    ]
  ]
 , {a, -0.6, 0.6}
 , PlotTheme -> "Scientific"
 ]
