1
$\begingroup$

Very new to Mathematica, so pardon my ignorance.

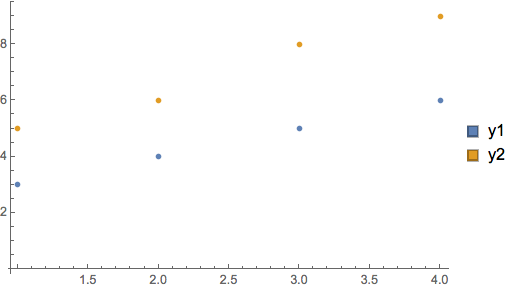
I am trying to plot x vs y1 and x vs y2 on the same ListPlot.

Here is what the data look like:

x = {1,2,3,4}

y1 = {3,4,5,6]

y2 results from FindIteration and gives me a result like this:

y2 = {{5},{6},{8},{9}}

How can I convert y2 such so it has the same shape as x and y1?

My iteration code is

Do[y2new = 
  ynew /. FindInstance[
    function1[x[[i]], ynew] == function2[x[[i]], ynew], ynew, Reals];
 y2[[i]] = ynew, {i, Length[x]}]

Is there a way to change the assignment of y2 values so the resulting array y2 has the same shape as x and y1?

$\endgroup$
1
  • $\begingroup$ You could write y2[[{i}]] = ynew $\endgroup$
    – Coolwater
    Commented Mar 5, 2018 at 9:42

2 Answers 2

2
$\begingroup$
x = {1, 2, 3, 4};
y1 = {3, 4, 5, 6};
y2 = {{5}, {6}, {8}, {9}};

To correct y2 when has been already generated, you just need to apply Flatten to y2 and then plot the transpose of x and the flattened y2.

ListPlot[
  {Transpose[{x, y1}], Transpose[{x, Flatten[y2]}]}, 
  PlotLegends -> SwatchLegend[{"y1", "y2"}]]

plot

Now let's look into generating the flat form of y2 directly. You did provide definitions for the two functions for which you are giving FindInstance, so I will use these two

f1[x_, y_] := Sin[x + 2 π y]
f2[x_, y_] := Cos[x + 2 π y]

I will use Map in its operator form, /@, to generate the list y2. Doing so will make the code much simpler than your Do-loop.

N[FindInstance[f1[#, y] == f2[#, y] && 0 <= y <= 1, y]][[1, 1, 2]] & /@

x

{0.465845, 0.30669, 0.147535, 0.98838}

Note tha t I use the part specification [[1, 1, 2]] to extract the numerical values for the list of instance found by FindInstance. Were I to use the usual extraction method

y /. N[FindInstance[f1[#, y] == f2[#, y] && 0 <= y <= 1, y]] & /@ x

I would get

{{0.465845}, {0.30669}, {0.147535}, {0.98838}}

a list of the same shape as the one that you generate.

$\endgroup$
1
  • $\begingroup$ The Flatten command did the trick for what I needed. $\endgroup$
    – fonsi
    Commented Mar 8, 2018 at 19:11
0
$\begingroup$
x = {1, 2, 3, 4}
y1 = {3, 4, 5, 6}
y2 = {{5}, {6}, {8}, {9}}
data = MapThread[{{#1, #2}, {#1, #3}} &, {x, y1, Catenate@y2}]
ListPlot[Transpose@data]
$\endgroup$

Your Answer

By clicking “Post Your Answer”, you agree to our terms of service and acknowledge you have read our privacy policy.

Not the answer you're looking for? Browse other questions tagged or ask your own question.