3
$\begingroup$

I'm working with an array of plots. I'd like to change the color and the legend for each of the plots in my array. For example, working with 10 plots: I generate the empty array of plots

allplots =  ConstantArray[0, 10];

Now I want to represent them, but looping both the color of PlotStyle (I don't want all of them Red) and also the legend "Code i" (for each i in the iteration, a different legend number i).

With all the same, I have:

For[i = 0, i < 10, 
 allplots[[i]] = 
  ListLogLogPlot[alldata[[i]], 
   PlotStyle -> {Red, Thickness[0.001]}, 
   PlotLegends -> {"Code i"} ], i++]

Any ideas about how can I do it?

$\endgroup$
2
  • 4
    $\begingroup$ Why should I avoid the For loop in Mathematica? $\endgroup$
    – corey979
    Commented Jul 1, 2018 at 11:58
  • $\begingroup$ Did any of the answers satisfied your need? There are things to do after your question is answered. But wait! It's a good idea to stay vigilant for some time, better approaches may come later improving over previous replies. Experienced users may point alternatives, caveats or limitations. New users should test answers before voting and wait 24 hours before accepting the best one. Participation is essential for the site, please do your part. $\endgroup$
    – rhermans
    Commented Jul 12, 2018 at 18:38

2 Answers 2

5
$\begingroup$
n = 6;
alldata = RandomReal[1, {n, 100}];
colors = RandomColor[n];

This

Table[ListLogLogPlot[alldata[[i]], PlotStyle -> colors[[i]], 
  PlotLegends -> "Code " <> ToString@i], {i, 1, n}]

enter image description here

or this

ListLogLogPlot[Evaluate@alldata, PlotStyle -> colors, 
 PlotLegends -> Table["Code " <> ToString@i, {i, 1, n}]

enter image description here

$\endgroup$
3
$\begingroup$

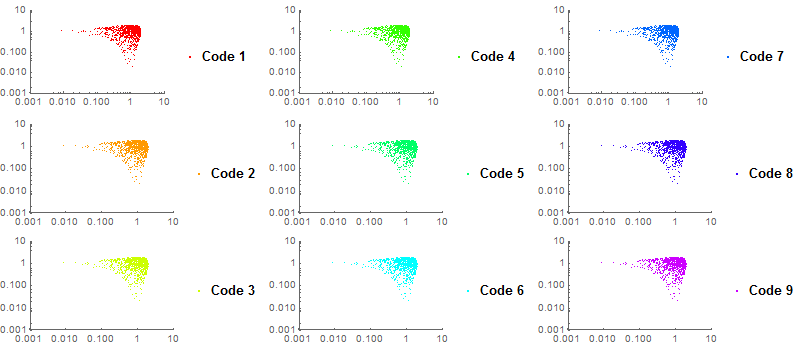
The answer by @corey979 is very good. Here I do basically the same, but with the following difference

Here is my take

Multicolumn[
 Module[
  {
   niterations = 9,
   data = RandomPoint[Disk[{1,1}], 1000]
   },
  Table[
   ListLogLogPlot[
    data
    , PlotStyle -> Hue[0.8 Rescale[k, {1, niterations}]]
    , PlotLegends -> {StringTemplate["Code ``"][k]}
    , PlotRange -> {{10^-3, 10}, {10^-3, 10}}
    ]
   , {k, niterations}
   ]]]

Mathematica graphics

$\endgroup$
4
  • $\begingroup$ Is there any way to choose the colors that you want? Like making an array of points? Thanks ;) $\endgroup$ Commented Jul 1, 2018 at 13:31
  • $\begingroup$ @GuillermoMartínezSomonte loo at @corey979's answer, instead of colors = RandomColor[n]; make your own list of colours and assign it to colors. $\endgroup$
    – rhermans
    Commented Jul 1, 2018 at 14:08
  • $\begingroup$ Nice, I somehow didn't know about Multicolumn. Why StringTemplate instead of <>? $\endgroup$
    – corey979
    Commented Jul 1, 2018 at 14:33
  • $\begingroup$ @corey979 when things become complex I find that StringTemplate is more readable. $\endgroup$
    – rhermans
    Commented Jul 1, 2018 at 14:35

Your Answer

By clicking “Post Your Answer”, you agree to our terms of service and acknowledge you have read our privacy policy.

Not the answer you're looking for? Browse other questions tagged or ask your own question.