3
$\begingroup$

I'm trying to make it so that the color of the dot at the top is the color of the vertical line that goes down to the axis.

f[x_] := Last[FixedPointList[# - Sin[#]/Cos[#] &, x]]/π;
start = 1;
stop = 2.2;
steps = 1200;
window = 1.1;
stepsize = N[(stop - start)/steps];
range = Range[start, stop, stepsize];
p1 = 
  ListPlot[
    Table[Style[Sin[t], Hue[f[t]/(10 π)]], {t, start, stop, stepsize}], 
    PlotStyle -> PointSize[Medium], 
    PlotRange -> Automatic, 
    Filling -> Axis];
Show[p1, ImageSize -> 1000]

But it just fills it with blue. I also can not figure out how to make the bottom axis the range instead of the natural numbers, but that's less important right now.

$\endgroup$
1
  • $\begingroup$ Last[FixedPointList[# - Sin[#]/Cos[#] &, x]]/π can be shortened to FixedPoint[# - Sin[#]/Cos[#] &, x]/π $\endgroup$
    – Bob Hanlon
    Commented Oct 12, 2017 at 4:52

2 Answers 2

6
$\begingroup$

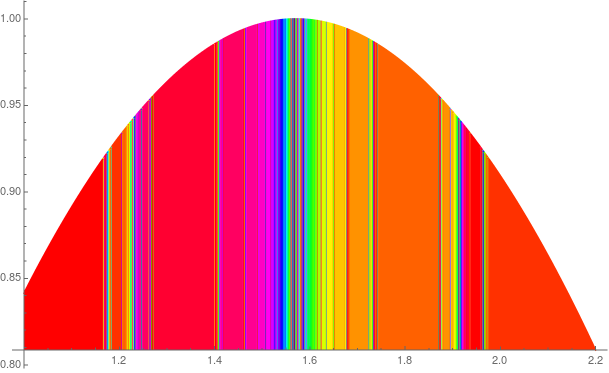
I'm not exactly sure why you use ListPlot with a table instead of calling Plot with a color function:

Plot[Sin[t], {t, start, stop}, ColorFunction -> (Hue[f[#]/(10 Pi)] &),
  ColorFunctionScaling -> False, Filling -> Axis, 
  PlotPoints -> 1200, MaxRecursion -> 0]

Mathematica graphics

$\endgroup$
2
  • $\begingroup$ Probably because im still fumbling my way thew this programing thing. Thank you so much! I spent so much time looking things up in the references and you solved it in just seconds, im in awe! $\endgroup$
    – Wombles
    Commented Oct 12, 2017 at 3:42
  • $\begingroup$ @Wombles When you want to have the same resolution as in your ListPlot, you should use the options PlotPoints -> 1200, MaxRecursion -> 0 in Plot. $\endgroup$
    – halirutan
    Commented Oct 12, 2017 at 15:39
2
$\begingroup$

You are computing so many tightly packed values of Sin in your table that it makes no sense to make a list plot with filling. The plot elements are like a bunch of lollypops being scrunched too close together. It is better to forget about the pops at end the sticks and just draw the sticks. This is easily done with Graphics.

f[x_] := Last[FixedPointList[# - Sin[#]/Cos[#] &, x]]/π
Module[{start, stop, steps, domain, lines},
  start = 1.;
  stop = 2.2;
  steps = 500;
  domain = Subdivide[start, stop, steps];
  lines = Table[{Hue[f[t]/(10 π)], Line @ {{t, .8}, {t, Sin[t]}}}, {t, domain}];
  Graphics[lines, Axes -> True, AspectRatio -> 1/GoldenRatio, ImageSize -> 450]]

This gives
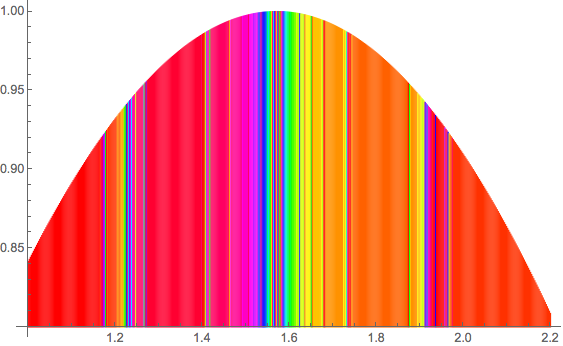
graphics

which is very much like the plot halirutan shows in his answer.

Update

This is attempt to address an issue raised by halirutan in some comments he made.

Yes, I see there are color artifacts being created -- some kind of color moire pattern is showing up because even reducing the number of lines to 500 from the OP's 1200 is packing too many lines into the rendered image at the size specified.

The artifacts can be reduced if not entirely eliminated by making a better choice of both the number lines and their thickness. Here is what I think is such better choice.

Module[{start, stop, steps, domain, lines},
  start = 1.;
  stop = 2.2;
  steps = 280;
  domain = Subdivide[start, stop, steps];
  lines = Table[{Hue[f[t]/(10 π)], Line @ {{t, .8}, {t, Sin[t]}}}, {t, domain}];
  Graphics[{AbsoluteThickness[2], lines},
    Axes -> True,
    AspectRatio -> 1/GoldenRatio,
    ImageSize -> 450]]
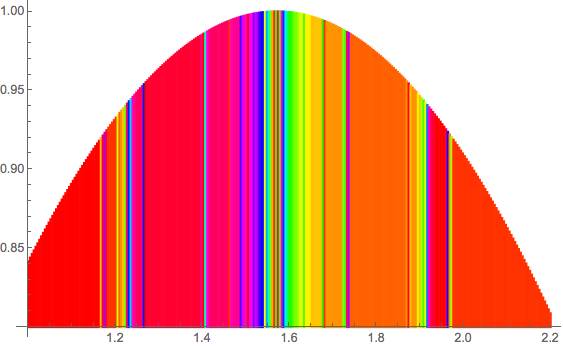
graphics

Clearly Mathematica's filling algorithm is more sophisticated than just drawing lines as I did. That certainly makes using Plot with Fill a better approach than mine.

$\endgroup$
5
  • $\begingroup$ I'm not sure why this happens, but there shouldn't be any color variations in the range [0, 0.8]. Look at Table[f[x]/(10 Pi), {x, 0, .8, .0001}] //DeleteDuplicates. Do you know why your colors wobble in those constant regions? $\endgroup$
    – halirutan
    Commented Oct 12, 2017 at 15:38
  • $\begingroup$ @halirutan. I don't understand what you are asking. The domain extent [0, .8] doesn't appear in my plot. I am plotting over [1., 2.2]. $\endgroup$
    – m_goldberg
    Commented Oct 12, 2017 at 21:55
  • $\begingroup$ Sorry, what I meant is the regions that should be uniformly colored. I have updated the image in my post. See the region [2.0, 2.2]. It's completely one color while in your image there are variations. I wondered why that is. Checking this region shows one value for f: Table[f[x]/(10 Pi), {x, 2, 2.2, .0001}] // DeleteDuplicates $\endgroup$
    – halirutan
    Commented Oct 12, 2017 at 22:06
  • $\begingroup$ After trying your code I see that it is a rendering artifact that comes from using Line. If you resize your graphics, you see how the color shows aliasing artifacts that shift. $\endgroup$
    – halirutan
    Commented Oct 12, 2017 at 22:16
  • $\begingroup$ @halirutan. I have made an update which attempts to address the issue you are raising. $\endgroup$
    – m_goldberg
    Commented Oct 13, 2017 at 4:41

Your Answer

By clicking “Post Your Answer”, you agree to our terms of service and acknowledge you have read our privacy policy.

Not the answer you're looking for? Browse other questions tagged or ask your own question.