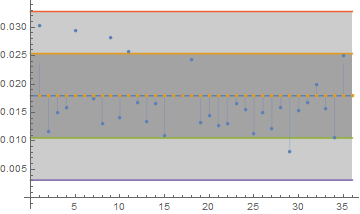
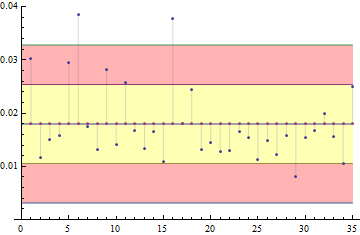
In the following plot,
- why is there some non connected dots,
- why the colors are'nt true.
elec = {66.`, 600.`, 200.`, 126.`, 68.`, 52.`, 114.`, 229.`, 71.`,
   141.`, 39.`, 119.`, 224.`, 121.`, 457.`, 53.`, 167.`, 82.`, 304.`,
   138.`, 235.`, 154.`, 181.`, 129.`, 1411.`, 134.`, 164.`, 126.`,
   369.`, 130.`, 179.`, 100.`, 192.`, 472.`, 80.`};
sieg = {2.`, 7.`, 3.`, 2.`, 2.`, 2.`, 2.`, 3.`, 2.`, 2.`, 1.`, 2.`,
   3.`, 2.`, 5.`, 2.`, 3.`, 2.`, 4.`, 2.`, 3.`, 2.`, 3.`, 2.`, 16.`,
   2.`, 2.`, 2.`, 3.`, 2.`, 3.`, 2.`, 3.`, 5.`, 2.`};
r = sieg/elec
m = Mean[r]
mm = Table[m, {i, 36}];
s = StandardDeviation[r]
g1 = ListPlot[{sieg/elec, mm}, Filling -> {1 -> {2}}];
g2 = Plot[ {m, m + s, m - s, m + 2 s, m - 2 s}, {x, 0, 36},
   Filling -> {1 -> {5}, 1 -> {4}, 1 -> {2}, 1 -> {3}},
   FillingStyle -> {{Opacity[.001], LightYellow},
     LightBlue, {Opacity[.001], Red}}];
Show[g2, g1]


PlotRange -> Alltog1. Try with1 -> {5, Directive[Opacity[.001], LightYellow]}forFilling, also opacity0.001means this is almost transparent. $\endgroup$