2
$\begingroup$

Consider this ListLinePlot

ListLinePlot[Exp[#] & /@ Range[0, 1, 0.05], PlotRange -> {1, 2}, 
             Frame -> True, Mesh -> Full]

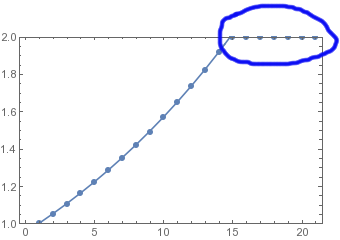
enter image description here

How to get rid of this extra on the upper frame? (Is it a bug!)

One walk around is using a suitable PlotRangePadding along y axis, but I want to avoid that (because I have a lot of sets with different range and I don't want to specify different padding for each of them manually)

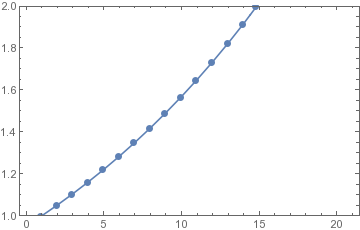
This does not appear if I use PlotMarkers instead of Mesh.

ListLinePlot[Exp[#] & /@ Range[0, 1, 0.05], PlotRange -> {1, 2}, 
              Frame -> True, PlotMarkers -> {Automatic, 10}]

enter image description here

Is it possible to get the same output with Mesh?

$\endgroup$
1
  • 1
    $\begingroup$ As a reminder: when asking about unexpected behavior, it is customary to include the version number and the OS. $\endgroup$ Commented Aug 30, 2017 at 23:16

1 Answer 1

1
$\begingroup$

A workaround:

ListLinePlot[Exp[#] & /@ Range[0, 1, 0.05],
  PlotRange -> {1, 2},
  Frame -> True,
  Mesh -> All] /. Point[{a__, _, b_}] :> Point[{a, b}]

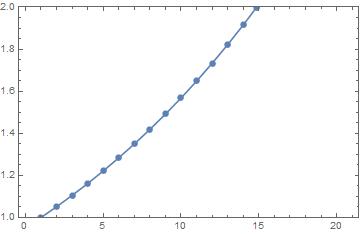
enter image description here

Use Mesh -> All and delete the next to last point

$\endgroup$

Not the answer you're looking for? Browse other questions tagged or ask your own question.