6
$\begingroup$

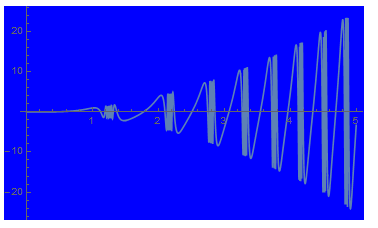
Let's say I have a function that I've plotted, like so:

a = Plot[f, {x, 0, 5}, Background -> Blue]

enter image description here

So I don't really have access to the function anymore, but I want to replot it with a changed property of the graph, for example, I want to make the color of the line Black, or the background Red.

How can I do that without replotting it, or not having access to the function again?

I know I can access the original color using Option[], like:

Last@Last@Options[a, Background]

But SetOptions and SetProperty don't really work. It seems like SetOptions sets the general property for plots in general, and SetProperty isn't for this. (SetProperty[a, Background -> Red] gives the error that my plot isn't an object with properties. SetOptions[a, Background -> Red] says that my argument plot isn't a symbol or stream.)

Is there a way to do this?

$\endgroup$
4

2 Answers 2

6
$\begingroup$

If you have the plot in Mathematica format (for instance saved in an unexecuted Mathematica notebook) but not the code that created it, then copy it into a new line of code, like

enter image description here

to obtain the same plot with a blue background. The point is, without the code to generate the plot, execute the instructions directly on the plot itself.

enter image description here

Addendum

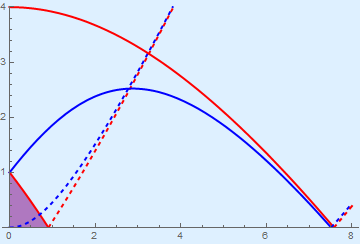
It is natural to ask whether the approach give by kgir would work with the more complicate plot used in this answer.

enter image description here

enter image description here

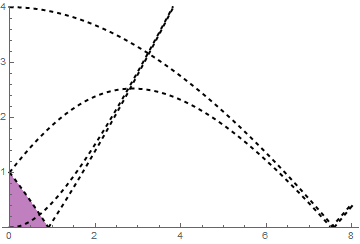
The line styles are changed, but the background is not. The reason can be seen from

enter image description here

(* {} *)

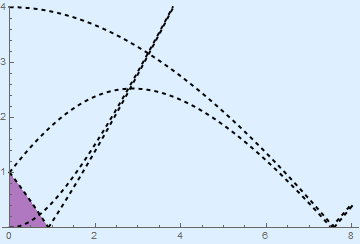
Background does not appear in the internal code for the plot, so it cannot be changed in this way. Instead, Append the command to the plot. (Using Show, as above, also would work in this case.)

enter image description here

enter image description here

More generally, for complicated plots it is necessary to peer inside the plot by

enter image description here

and tailor the needed commands to change or add to the internal instructions of the plot. For instance, one might then use

enter image description here

which both removes the old line styling commands and adds the new ones, to obtain the plot just above.

Second Addendum

As requested in a comment below, the code used to create the original plot is

Plot[Flatten@Table[{MathieuCharacteristicA[r, q], 
    MathieuCharacteristicB[r + 1, q], -MathieuCharacteristicA[r, q], 
   -MathieuCharacteristicB[r + 1, q],}, {r, 0, 1}], {q, 0, 8}, 
   Evaluated -> True, PlotRange -> {All, {0, 4}}, 
   PlotStyle -> {Directive[Thick, Blue], Directive[Thick, Red], 
       Directive[Thick, Dashed, Blue], Directive[Thick, Dashed, Red]}, 
   Filling -> Table[{2 n + 1 -> {{2 n + 2}, Directive[Opacity[1/2], Purple]}}, {n, 0, 3}]]

which is based on a recent question.

$\endgroup$
5
  • $\begingroup$ (1) could you please post the code that generate the plot in your answer; (2) your remark ( Background does not appear in the internal code for the plot ) is incorrect, you should have used Cases[graphicsobject, HoldPattern[Background -> _], Infinity]. Background is not a function so, unsurprisingly, the pattern _Background does not match anything $\endgroup$
    – kglr
    Commented Jun 26, 2017 at 19:28
  • $\begingroup$ ... forgot to add: if the input graphics object didn't have an explicit Background option, the replacement rule /. {HoldPattern[Background -> _] :> Rule[Background, Red], ll_Line :> {Thick, Dashed, ll} wouldn't work. But, the OP's input plot already has Background, $\endgroup$
    – kglr
    Commented Jun 26, 2017 at 19:36
  • $\begingroup$ @kglr Thanks for pointing out that my original search for Background was incorrect. I have replaced it, but with the same result. I also searched the code by eye and could not find it. I agree that lack of this option is surprising. As requested, I also posted the code I used (in a separate notebook) to generate the original plot. Please be assured that my answer was not meant to criticize yours in any way but only to point out that for complicated plots it may be necessary to tailor the commands the change the plot to the details of the plot's internal code. $\endgroup$
    – bbgodfrey
    Commented Jun 26, 2017 at 19:43
  • $\begingroup$ Actually Show is the idiomatic and recommended way to add/replace option(s) in a Graphics object which will work regardless of whether the latter contains the option(s) or not. Append will not work if the Graphics object already contains the option(s). $\endgroup$ Commented Jun 26, 2017 at 23:40
  • $\begingroup$ @AlexeyPopkov I agree that Show is the better way for changes that can be accomplished by specifying options. I used Append simply to show that alternatives exist in this case. $\endgroup$
    – bbgodfrey
    Commented Jun 26, 2017 at 23:48
2
$\begingroup$

Perhaps:

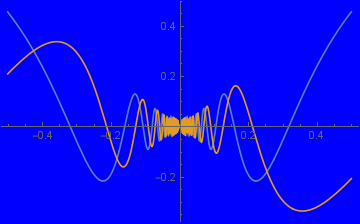
a = Plot[{x Sin[1/x], x Cos[1/x]}, {x, -1/2, 1/2}, Background -> Blue]

Mathematica graphics

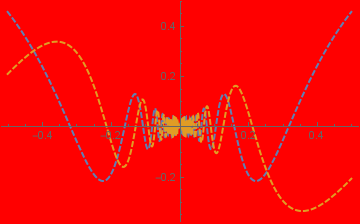
a /. {HoldPattern[Background->_] :> Rule[Background, Red], 
    ll_Line :> {Thick, Dashed, ll}}

Mathematica graphics

Note: a /. {Rule[Background, _] :> Rule[Background, Red], ll_Line :> {Thick, Dashed, ll}} also works.

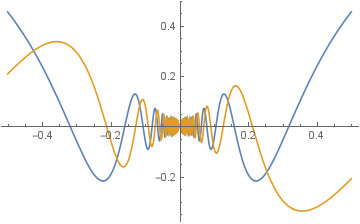
Update: If the input plot does not have an explicit Background option, as in

b = Plot[{x Sin[1/x], x Cos[1/x]}, {x, -1/2, 1/2}]

Mathematica graphics

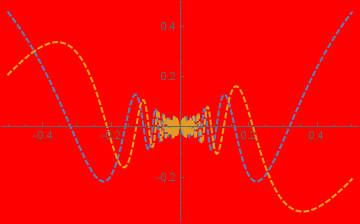
then the replacement rule above would not work. You could use

Show[b, Background->Red]/. { ll_Line :> {Thick, Dashed, ll}}

to get

Mathematica graphics

See this answer by Mr.Wizard for methods to modify plot styles in more general ways.

$\endgroup$

Your Answer

By clicking “Post Your Answer”, you agree to our terms of service and acknowledge you have read our privacy policy.

Not the answer you're looking for? Browse other questions tagged or ask your own question.