0
$\begingroup$

I have an M/M/1 queue. In the documentation says that one can Slice distribution of an M/M/1 queue with inexact parameters. This slice behaves (somehow) as a ProbabilityDistribution that can be given as a parameter to for example, PDF[]. The relevant code is:

Q = QueueingProcess[4.3, 5];
DiscretePlot[PDF[Q[4], x], {x, 0, 10}]

I want to compute the expected value of L (number of entities in the system/length of the queue) after a finite time. However, if I try to do Mean[Q[4]] (which seems logical if the slice is indeed a discrete probability distribution,) I don't get a result, but an unevaluated expression.

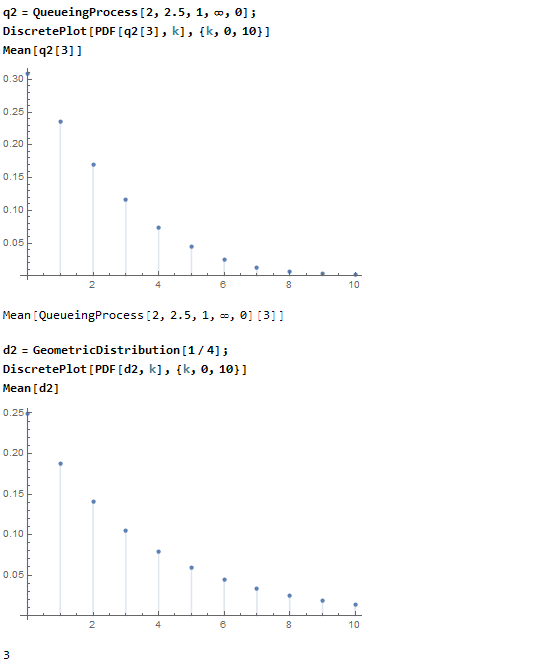
Below is a screenshot of a more complete example of the situation:

Screenshot of slice working with PDF but not Mean

Question: Is there a function or simple expression to get the expected value, or I just have to go for an infinite summation?

$\endgroup$
3
  • 1
    $\begingroup$ Use NExpectation[] instead: NExpectation[k, k \[Distributed] Q[4]] $\endgroup$ Commented May 17, 2017 at 18:56
  • $\begingroup$ @J.M. wow, quick. Thanks! I had tried Expectation[] but not the numeric version. Would you like to write that as an answer? $\endgroup$
    – Rafael
    Commented May 17, 2017 at 18:59
  • 1
    $\begingroup$ If you can wait a bit, sure... $\endgroup$ Commented May 17, 2017 at 19:10

2 Answers 2

2
$\begingroup$
qp = QueueingProcess[2, 5/2, 1, ∞, 0];

PDF[qp[3], k]
   PDF[QueueingProcess[2, 5/2, 1, ∞, 0][3], k]

Since no symbolic evaluation was happening for the PDF, Expectation[] (and thus, Mean[]) won't work either:

Expectation[k, k \[Distributed] qp[3]]
   Expectation[k, k \[Distributed] QueueingProcess[2, 5/2, 1, ∞, 0][3]]

Mean[qp[3]]
   Mean[QueueingProcess[2, 5/2, 1, ∞, 0][3]]

However, you can force numerical evaluation by applying N[]:

N[Mean[qp[3]], 20]
   1.7875077027096111173

but this is not very flexible. So, I would recommend using NExpectation[] directly:

NExpectation[k, k \[Distributed] qp[3], WorkingPrecision -> 20]
   1.7875077027096111173
$\endgroup$
1
$\begingroup$

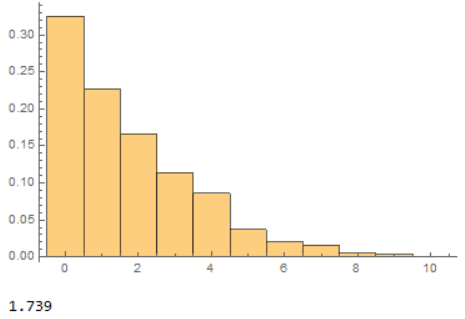
You can also simulate:

q = QueueingProcess[2, 2.5, 1, Infinity, 0];
rf = RandomFunction[q, {0, 10}, 1000];
t3 = rf["SliceData", 3];
Histogram[t3, Automatic, "PDF"]
Mean[t3] // N

enter image description here

$\endgroup$

Your Answer

By clicking “Post Your Answer”, you agree to our terms of service and acknowledge you have read our privacy policy.

Not the answer you're looking for? Browse other questions tagged or ask your own question.