1
$\begingroup$

I am considering the Earling-B or m/m/c/c process.

Let the request arrival rate follows Poisson Process with average rate, $\lambda$

Let the service time follows Exponential Distribution, i.e., $\mu$ is the mean of Exponential Distribution.

Let's say, I have a grid of $c \times T$. Here $c=5$, i.e., in the Queueing process, there are 5 servers and 5 requests can be served at most concurrently. Let, $T=100$ is the number of time-slots that I need to simulate. Therefore, each block in the x-axis represents a time-slot and each block in the y-axis is the amount of resource required to serve a request.

For example,

Let the number of requests at the first time-slot is 3. The first and the third requests need service time of 2 times slots, while the second request requires service time of only 1 time-slot.

As a result, in the grid,

The first row will have two grid-element (first and second column) filled

The second row will have one grid-element (first column) filled

The third row will have two grid-element (first and second column) filled

Now, let's say, at the second time-slot, the number of requests is 5. In this case, due to the nature of Earling-B or m/m/c/c Queueing Process, only 3 more requests can be served at this particular time-slot as we already have two requests being served (first and third request arrived at first time-slot). Other requests are blocked or lost.

How do I generate the number of resources being used by the system in different time-slots?

Lets assume, $\lambda=0.2$ per time-slot

$\mu=2$ time-slots

$\endgroup$
5
  • $\begingroup$ Two things: A poisson distribution won't work for QueueingProcess. According to the documentation, you need a continuous one. Secondly, did you look at the page on Queuing Processes in the docs? $\endgroup$
    – Lukas Lang
    Commented Sep 5, 2017 at 8:28
  • $\begingroup$ @Mathe172, Yes, I have looked at it. But I have Poisson distribution for the request arrivals. How can I solve my problem? I have edited the title of my question. $\endgroup$ Commented Sep 5, 2017 at 8:40
  • 1
    $\begingroup$ Don't you mean that you have a PoissonProcess for the arrivals, rather than a PoissonDistribution? I think that's the confusion here. A PoissonProcess should work in a QueueingProcess. $\endgroup$ Commented Sep 5, 2017 at 8:49
  • $\begingroup$ Also: note that having a Poisson process for the arrivals is equivalent to having an exponential distribution for the inter-arrival times. $\endgroup$ Commented Sep 5, 2017 at 8:56
  • $\begingroup$ @SjoerdSmit, Yes, it is a Poisson process with average rate [Lambda]. How do I use it to generate the number of resources used at each time-slot? $\endgroup$ Commented Sep 5, 2017 at 9:07

1 Answer 1

0
$\begingroup$

You should be able to get the data you want using QueueProperties and/or RandomFunction (both of which are linked in the docs of QueueingProcess and Queueing Processes):

q = QueueingProcess[\[Lambda], \[Mu], c, c]
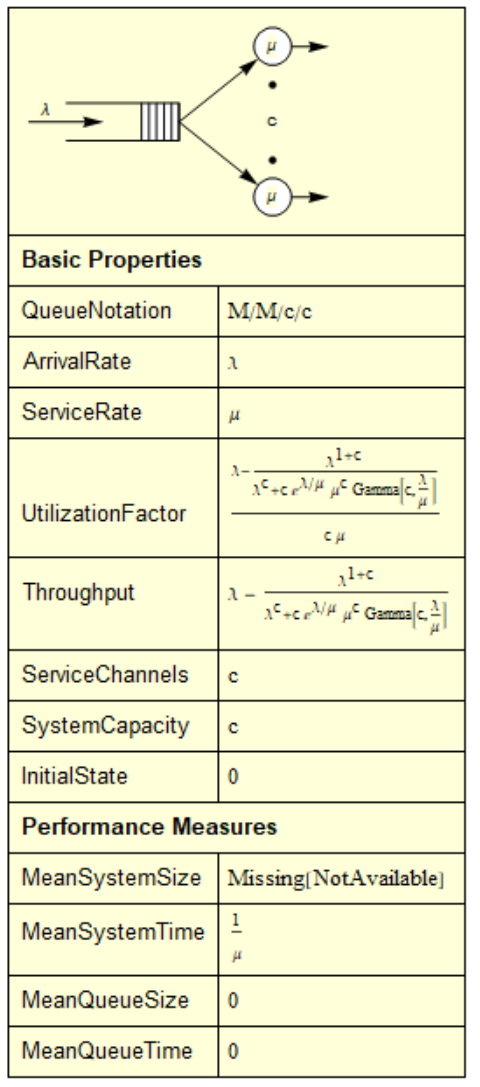
Simplify[QueueProperties[q], c > 0 && c \[Element] Integers]

yields:

You can also query e.g. the throughput or utilization factor directly for your values:

In[1]:= QueueProperties[q /. {\[Lambda] -> 0.2, \[Mu] -> 2, c -> 5}, "Throughput"]
Out[1]= 0.2
In[2]:= QueueProperties[q /. {\[Lambda] -> 0.2, \[Mu] -> 2, c -> 5}, "UtilizationFactor"]
Out[2]= 0.02

You can also simulate your process (obviously, you need to insert actual values here):

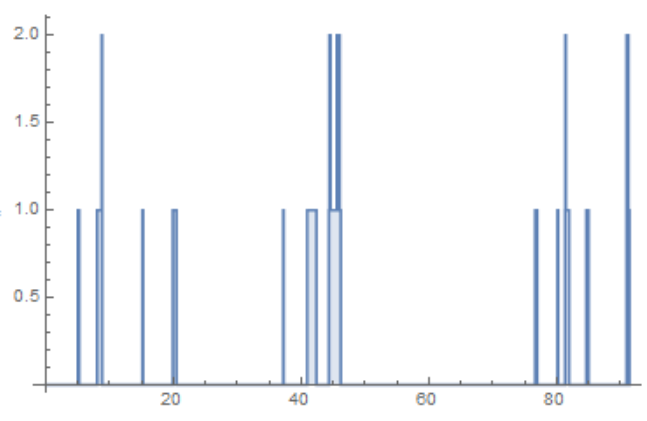
d = RandomFunction[q /. {\[Lambda] -> 0.2, \[Mu] -> 2, c -> 5}, {0, 100}]
ListStepPlot[d, Filling -> Axis]

May yield:

where the plot shows how many slots are used at each point in time.

Note

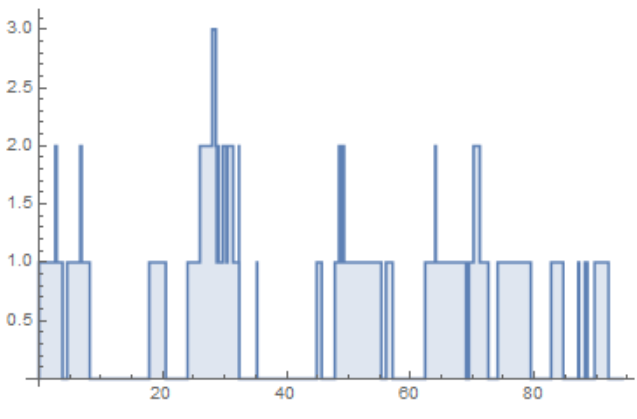
If you meant $\mu=\frac{1}{2}$, the results are a bit more interesting (as the queue is not so empty):

In[1]:= QueueProperties[q /. {\[Lambda] -> 0.2, \[Mu] -> 1/2, c -> 5}, "Throughput"]
Out[1]= 0.199989
In[2]:= QueueProperties[q /. {\[Lambda] -> 0.2, \[Mu] -> 1/2, c -> 5}, "UtilizationFactor"]
Out[2]= 0.0799954

$\endgroup$
1
  • $\begingroup$ Thanks a lot for your answer. It almost answers my question. Where does it say that \[Lambda] is the average rate of the Poisson process and \[Mu] is the mean of Exponential distribution ? If it is not the case then how do I guarantee this? $\endgroup$ Commented Sep 6, 2017 at 1:46

Your Answer

By clicking “Post Your Answer”, you agree to our terms of service and acknowledge you have read our privacy policy.

Not the answer you're looking for? Browse other questions tagged or ask your own question.