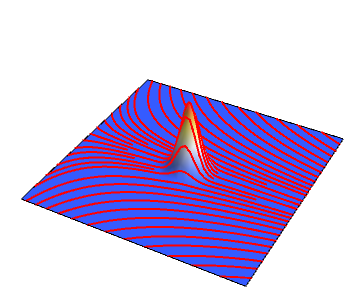
I am trying to replace the grid lines of a Plot3D with the output of a StreamPlot using MeshFunction. Here is an example:
mu = {{0, 0, 0}};
c = 0.1;
sigma = {{c, 0, 0}, {0, c, 0}, {0, 0, c}};
sigmaInv = Inverse[sigma];
dsigma = Det[sigma];
gauss3d[x_, y_, z_] := Exp[-(1/2)
     (({{x, y, z}} - mu).sigmaInv.Transpose[{{x, y, z}} - mu])[[1, 1]]
    ] / Sqrt[(2 Pi)^3 dsigma];
bl = -4;
bh = 4;
Plot3D[gauss3d[x, y, 0.] , {x, bl, bh}, {y, bl, bh},
 PlotRange -> {-0.01, 2.5}, ColorFunction -> "TemperatureMap",
 Axes -> None, Boxed -> {},
 MeshFunctions -> { Sqrt[#1^2 + #2^2 + #3^2] & },
 Mesh -> 10, LabelStyle -> {White}]
kb = 0.9;
kn = 0.2;
kt = 0;
theta[x_, y_, z_] := ArcTan[ (kt*x - kn*y)/(1 + kn*x - kt*y) ] + kb*z;
vvvZero =
 StreamPlot[{-Cos[theta[x, y, 0]], -Sin[theta[x, y, 0]]}, {x, bl,
   bh}, {y, bl, bh},
  StreamStyle -> {"Line", Red, Thick}, Frame -> False]
I would essentially like the lines of the StreamPlot to become the mesh lines of Plot3D, instead of the Sqrt[#1^2 + #2^2 + #3^2] &.
Any other suggestions are welcome; thanks!

