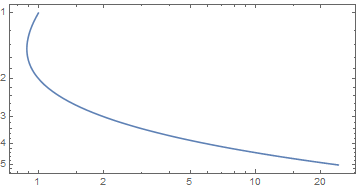
I have a parametric plot and would like to display it double logarithmic with one axis reversed.
For example how can I get two log axes for this plot:
ParametricPlot[{Abs[Gamma[z]], z}, {z, 1, 5}, ScalingFunctions -> {"Log", "Reverse"}]
You can use your own pure function as a scaling function; you just have to provide an appropriate inverse:
ParametricPlot[
  {Abs[Gamma[z]], z}, {z, 1, 5},
  ScalingFunctions -> {"Log10", {(-Log10[#] &), (10^-# &)}},
  Axes -> False, Frame -> True
]

Logof thezaxis since it includes non-positive values. $\endgroup$