6
$\begingroup$

The FFT amplitudes of the following image

enter image description here

can be displayed with:

fftimg = ImagePeriodogram[img];
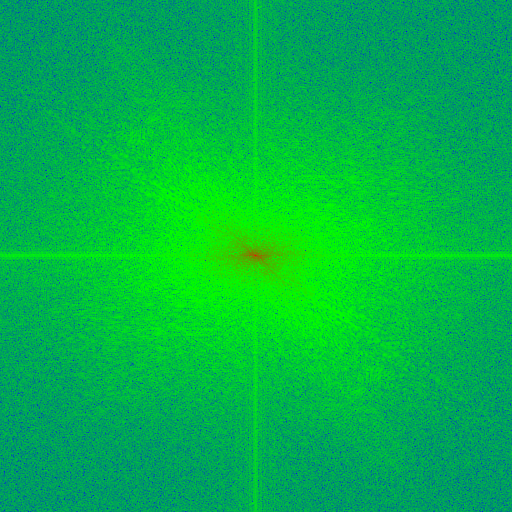
Colorize[fftimg, ColorFunction -> (Blend[{Blue, Green, Red}, #] &)]

enter image description here

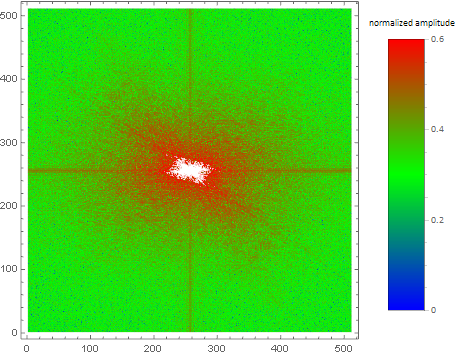
To plot a legend I used the following code:

fftimgData = ImageData[ImageRotate[fftimg, 90 Degree]];
dim = Dimensions[fftimgData];
x = Range[1, dim[[1]], 1];
y = Range[1, dim[[2]], 1];
data = Flatten[Outer[{#1, #2, fftimgData[[#1, #2]]} &, x, y], 1];

ListDensityPlot[data, 
 ColorFunction -> (Blend[{Blue, Green, Red}, #] &), 
 PlotLegends -> 
  Placed[BarLegend[Automatic, LegendMargins -> {{0, 0}, {10, 5}}, 
    LegendMarkerSize -> {40, 300}, LegendLabel -> "normalized amplitude", 
    LabelStyle -> {FontFamily -> "Calibri", FontSize -> 10}], Right]]

enter image description here

This code is very slow. (47 sec on my computer)

What is a better solution to display a legend beside the resulting FFT image showing which brightness (=color) belongs to which amplitude?

$\endgroup$
1
  • 3
    $\begingroup$ You can create a custom legend and display it (e.g. Row or GraphicsRow) next to your image; see here. $\endgroup$
    – corey979
    Commented Nov 23, 2016 at 10:09

2 Answers 2

7
$\begingroup$

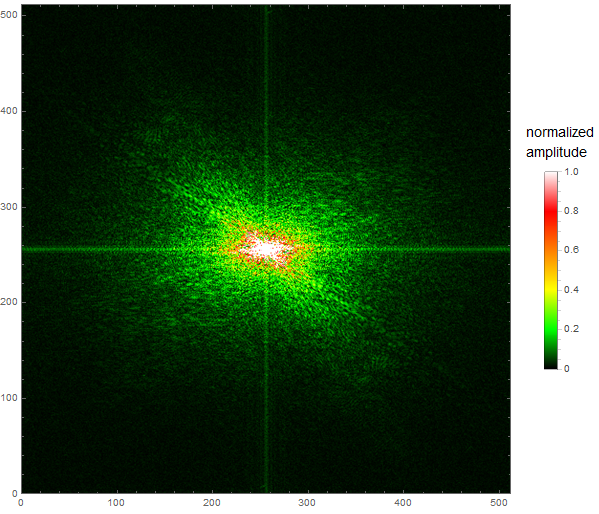
The following code performs the FFT manually, rescales it to $[0,1]$ and displays it with the BarLegend you wanted with about 0.2 seconds kernel time and 1s additional display-frontend time needed.

{w, h} = ImageDimensions[img];
fftData = Abs[Fourier[ImageData[ColorConvert[img, "Grayscale"]]*
     Table[(-1)^(i + j), {i, 1, h}, {j, 1, w}]]];
{fftMin, fftMax} = MinMax[fftData];

colorFunc[v_] := Blend[{Black, Green, Yellow, Orange, Red, White}, v];

Legended[Show[{Colorize[
    Image[(fftData - fftMin)/(fftMax - fftMin)*255], 
    ColorFunction -> colorFunc]}, Frame -> True], 
 BarLegend[{colorFunc[#] &, {0, 1}}, 
  LegendLabel -> Style["normalized\namplitude", 14]]]

(Save the graph with the Exportcommand otherwise the legend is not included.)

enter image description here

$\endgroup$
1
  • $\begingroup$ This solution is great, thank you. Do you see a possibility to show at the BarLegend the real data values fftData instead of the brightness values? $\endgroup$
    – lio
    Commented Nov 24, 2016 at 10:07
2
$\begingroup$

How to add a legend showing the amplitudes instead of brightness values:

With the help of Julien Kluges answer I have the following code, which is also showing the "frequency" along the axes:

img = ColorConvert[ExampleData[{"TestImage", "Lena"}], "Grayscale"];

fft = Fourier[ImageData[img]];
fft = RotateLeft[fft, Floor[Dimensions[fft]/2]];

fftAbsData = Abs[fft];

{fftAbsMin, fftAbsMax} = MinMax[fftAbsData];

myColorTable = 
  Flatten@{Table[{Blend[{Blue, Green, Yellow, Orange, Red}, x]}, {x, 1/256, 1, 1/256}]};

g = Colorize[Image[fftAbsData], ColorFunction -> (Blend[myColorTable, #] &)];

myLegend = 
  BarLegend[
    {myColorTable, {fftAbsMin,fftAbsMax}}, 
    LegendLabel -> "amplitude", LegendMarkerSize -> {40, 300}, 
    LabelStyle -> {FontFamily -> "Calibri", FontSize -> 15}
  ];

Legended[
  Graphics[
    Inset[g, Scaled[{.5, .5}], Automatic, Scaled[1]], Frame -> True, 
    FrameLabel -> {{"cycles/pixel", ""}, {"cycles/pixel", ""}}, 
    PlotRange -> {{-0.5, 0.5}, {-0.5, 0.5}}, 
    AspectRatio -> ImageAspectRatio@g
  ]
  , myLegend
]
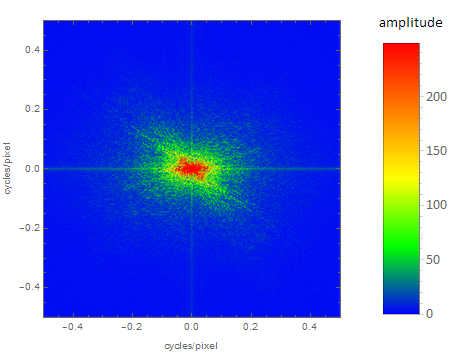
enter image description here

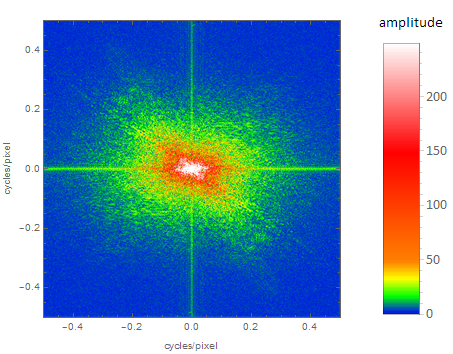
With a modified color table:

myColorTable = 
  Flatten@{Table[{Blend[{Blue, Green, Yellow, Orange}, x]}, {x, 1/50, 
      1, 1/50}], 
    Table[{Blend[{Orange, Red, White}, x]}, {x, 1/206, 1, 1/206}]};

one gets:
enter image description here

The same way the FFT for the phases is:

img = ColorConvert[ExampleData[{"TestImage", "Lena"}], "Grayscale"];

fft = Fourier[ImageData[img]];
fft = RotateLeft[fft, Floor[Dimensions[fft]/2]];

fftPhasesData = Arg@fft/Pi;

{fftPhasesMin, fftPhasesMax} = MinMax[fftPhasesData];

myColorTable = 
  Flatten@{Table[{Blend[{Blue, Green, Yellow, Orange, Red}, x]}, {x, 1/256, 1, 1/256}]};

g = Colorize[Image[(fftPhasesData - fftPhasesMin)/(fftPhasesMax - 
        fftPhasesMin)], ColorFunction -> (Blend[myColorTable, #] &)];

myLegend = 
  BarLegend[
    {myColorTable, {fftPhasesMin, fftPhasesMax}}, 
    LegendLabel -> "phase (\[Pi])", LegendMarkerSize -> {40, 300}, 
    LabelStyle -> {FontFamily -> "Calibri", FontSize -> 15}
  ];

Legended[
  Graphics[
    Inset[g, Scaled[{.5, .5}], Automatic, Scaled[1]], Frame -> True, 
    FrameLabel -> {{"cycles/pixel", ""}, {"cycles/pixel", ""}}, 
    PlotRange -> {{-0.5, 0.5}, {-0.5, 0.5}}, 
    AspectRatio -> ImageAspectRatio@g
  ]
  , myLegend
]
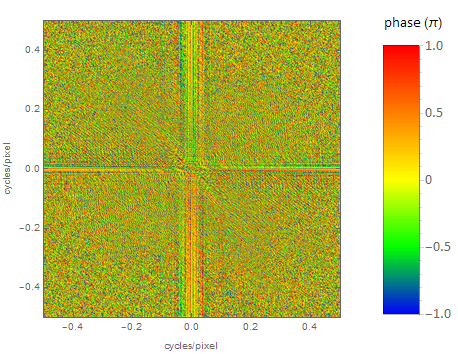
enter image description here

$\endgroup$

Your Answer

By clicking “Post Your Answer”, you agree to our terms of service and acknowledge you have read our privacy policy.

Not the answer you're looking for? Browse other questions tagged or ask your own question.