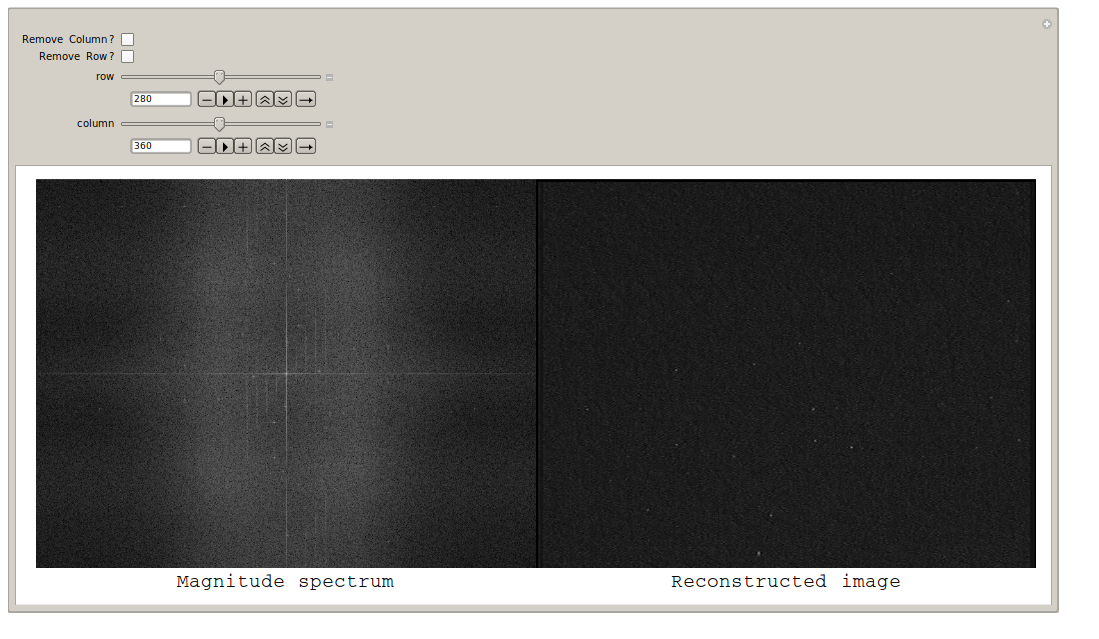
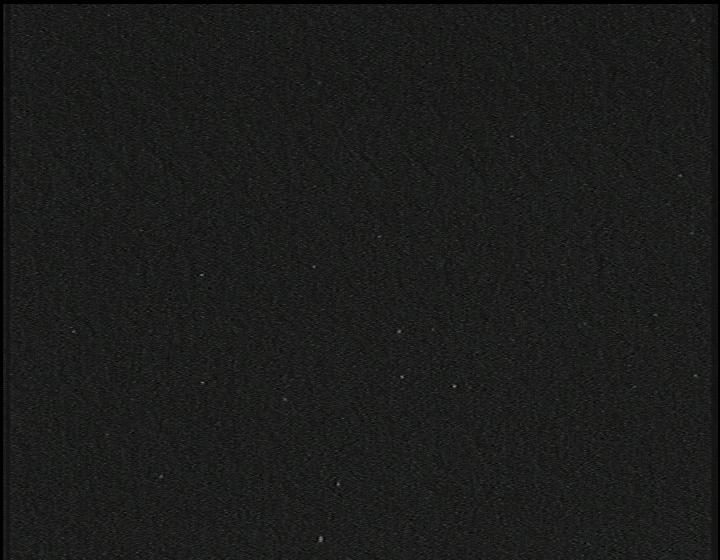
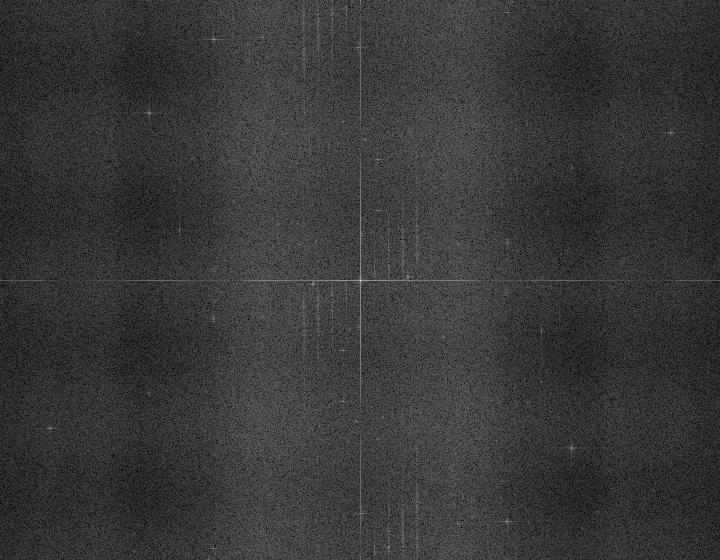
You have to reverse all the steps you took,
ifw = Chop@InverseFourier[fw, FourierParameters -> {1, 1}];
ifw = ifw*(-1)^Table[i + j, {i, nRow}, {j, nCol}];
idata = Map[{#, #, #} &, ifw, {2}];
GraphicsRow[{Image[idata],
  Image[data]}, ImageSize -> 800]
I noticed that the three channels of your data aren't exactly equivalent, though they are for most of the pixels. Just evaluate Length@Select[Flatten[data, 1], UnsameQ @@ # &] and you'll see that there are 78,825 pixels with some differences. Of course, their magnitude spectrum looks visually very similar,

but they aren't numerically identical. So really, you should split the three channels into different matrices, do a FFT on each, perform the subtraction you are going for, then do the inverse FFT, then combine them. Fairly straightforward to generalize the code to do that.
Edit
This wasn't in your question, but I thought I'd take a crack at removing the unwanted texture (never done anything like this before, so this is bound to be far from the most efficient way to do it).
It's clear from the magnitude spectrum that the problem comes from the zero frequency terms. Your image has 560 rows and 720 columns. I don't know if the zero comes at n/2 or n/2+1, so I just check the data,
Last@Ordering[Abs@fw[[100]]]
Last@Ordering[Abs@fw[[All, 100]]]
(* 361 *)
(* 281 *)
So we can just replace the 361st column with the average of the two columns nearest to it, and do the same for the 281st row. Perhaps it would be better to just remove these columns and rows, but this is my first attempt.
fw2 = fw;
fw2[[All, 361]] = Mean /@ fw2[[All, {360, 362}]];
fw2[[281]] = Mean@fw2[[{280, 282}]];
Look a the spectrum without these terms,
fudgeFactor = 50;
abs = fudgeFactor*Log[1 + Abs@fw2];
Labeled[a = Image[abs/Max[abs], ImageSize -> 300],
 Style["Magnitude spectrum", 18]]
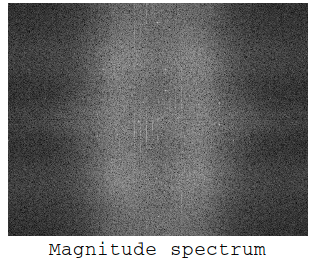
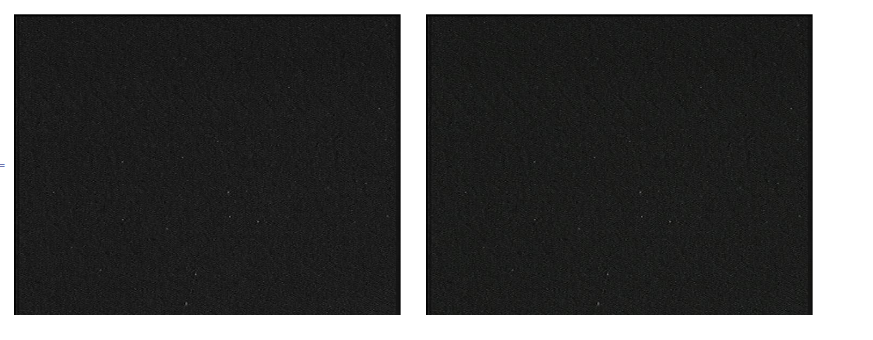
Now take the inverse FFT and compare to the original image,
ifw = Chop@InverseFourier[fw2, FourierParameters -> {1, 1}];
ifw = ifw*(-1)^Table[i + j, {i, nRow}, {j, nCol}];
idata = Map[{#, #, #} &, ifw, {2}];
GraphicsRow[{Image[idata], Image[data]}, ImageSize -> 1200]
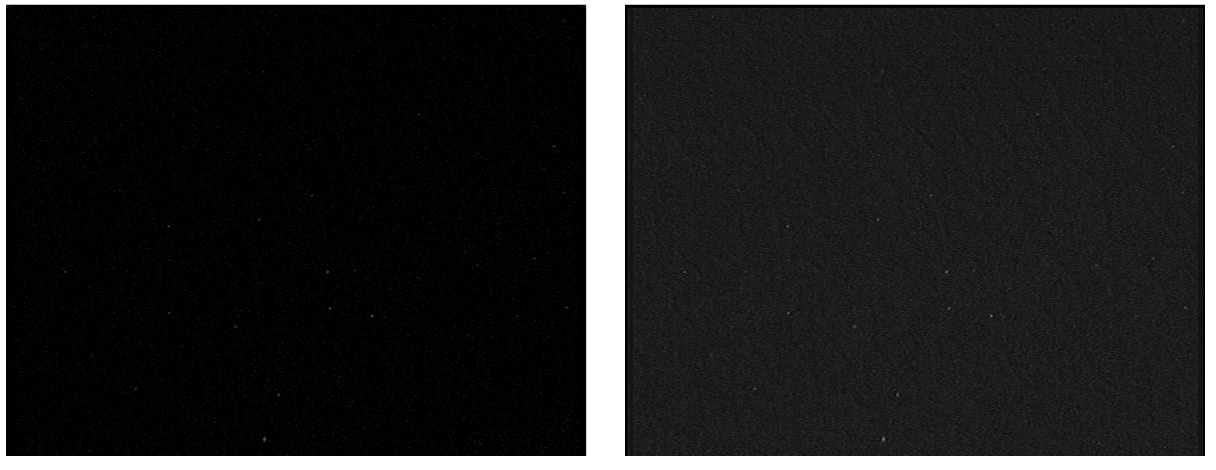
And here is the code for keeping all three channels,
{nRow, nCol, nChannel} = Dimensions[data];
d = data[[All, All, #]] & /@ Range[nChannel];
idata = Module[{d, fw, fw2, ifw},
     d = #*(-1)^Table[i + j, {i, nRow}, {j, nCol}];
     fw = Fourier[#, FourierParameters -> {1, 1}];
     fw2 = fw;
     fw2[[All, 361]] = Mean /@ fw2[[All, {360, 362}]];
     fw2[[281]] = Mean@fw2[[{280, 282}]];
     ifw = Chop@InverseFourier[fw2, FourierParameters -> {1, 1}];
     ifw = ifw*(-1)^Table[i + j, {i, nRow}, {j, nCol}];
     ifw
     ] & /@ d;

idata = Transpose[idata, {3, 1, 2}];

Image[idata]
Edit
A question was asked about how to tell which column or row to remove, and hopefully this should help in that regard:
img = Import["https://i.sstatic.net/XvkI1.jpg"];
data = ImageData[img];(*get data*){nRow, nCol, nChannel} =
 Dimensions[data];
d = data[[All, All, 2]];
d = d*(-1)^Table[i + j, {i, nRow}, {j, nCol}];
fw = Fourier[d, FourierParameters -> {1, 1}];
Manipulate[
 Module[{fw2, fudgeFactor, abs, ifw, idata, message},
  fw2 = fw;
  If[
   remcol,
   fw2[[All, column]] = Mean /@ fw2[[All, {column - 1, column + 1}]]
   ];
  If[
   remrow,
   fw2[[row]] = Mean@fw2[[{row - 1, row + 1}]]
   ];
  fudgeFactor = 50;
  abs = fudgeFactor*Log[1 + Abs@fw2];
  ifw = InverseFourier[fw2, FourierParameters -> {1, 1}];
  message = "";
  If[Max@Abs@Im@ifw/Max@Abs@Re@ifw > 10^-10,
   message =
    "Warning, Inverse FFT returned complex results,\n proceeding with \
real part only"];
  ifw = Re@ifw;
  ifw = ifw*(-1)^Table[i + j, {i, nRow}, {j, nCol}];
  idata = Map[{#, #, #} &, ifw, {2}];
  Row[{
    Labeled[Image[abs/Max[abs], ImageSize -> 500],
     Style["Magnitude spectrum", 18]],
    Labeled[Image[idata, ImageSize -> 500],
     Style["Reconstructed image", 18]],
    message}
   ]
  ],
 {{remcol, False, "Remove Column?"}, {True, False}},
 {{remrow, False, "Remove Row?"}, {True, False}},
 {{row, Floor[nRow/2]}, 2, nRow - 1, 1, Appearance -> "Open"},
 {{column, Floor[nCol/2]}, 2, nCol - 1, 1, Appearance -> "Open"},
 ContinuousAction -> False]
