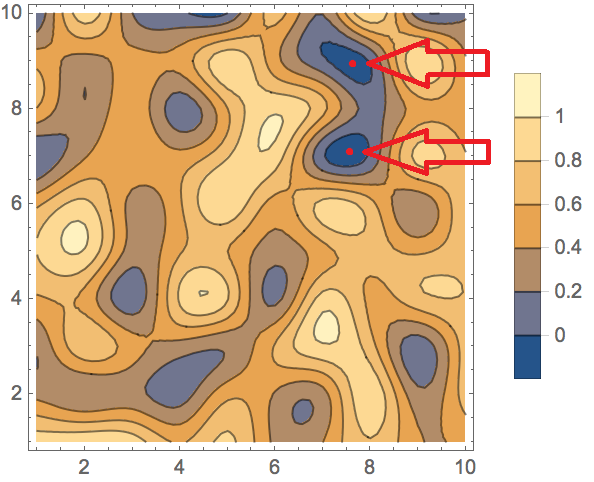
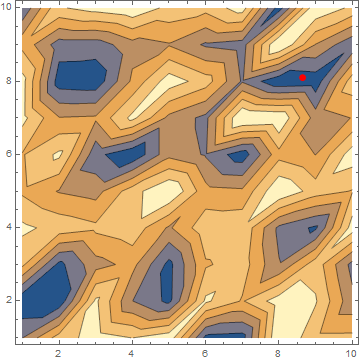
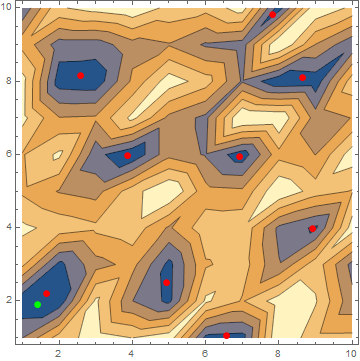
A have 2D function defined on some square (e.g. {x, 1, 10}, {y, 1, 10} with step 1). It's represented via array, e.g.: RandomReal[1, {10, 10}]. And I need to detect centers of "minimum areas" in the ListContourPlot[] of this data (probably using some threshold). For example, one of my samples has next representation and I want to find coordinates of red points:
I know I can go for converting the plot to the image and using some image-based segmentation to locate these areas and to define their centres, but it's too time-consuming approach (a have a lot of such samples).
So the question is: how do I find such points by analyzing "raw" data from my array (the faster - the better).
NB: there may be multiple target areas in different locations - I need them all...


FindMinimum[{f[x,y], 6 <= x <= 10, 8 <= y <= 10}, {x, y}]andFindMinimum[{f[x,y], 6 <= x <= 10, 6 <= y <= 8}, {x, y}]$\endgroup$6 <= x <= 10or8 <= y <= 10. $\endgroup${Position[f = RandomReal[1, {10, 10}], min = Min@f], min}you generate an array inf, and print its minimum value and all the positions where this value is achieved. $\endgroup$