added 441 characters in body
Source Link
george2079
  • 39.1k
  • 1
  • 44
  • 111
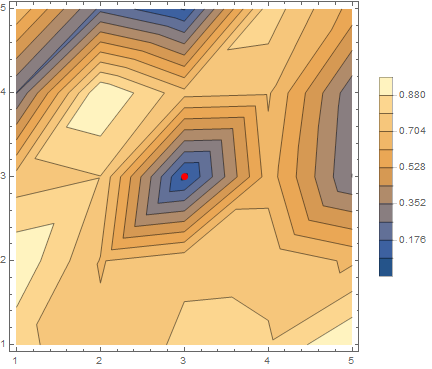
plotdata = ListContourPlot[RandomReal[1RandomReal[1, {10, 10}], ];

plot = ListContourPlot[data, PlotLegends -> Automatic, Contours -> 5];
p1 = RegionCentroid[
   Cases[Normal@plot, Line[x_] :> Polygon[x], Infinity][[-1]]];
Show[plot, Graphics[{Red, PointSize[.02], Point[p1]}]]

enter image description here

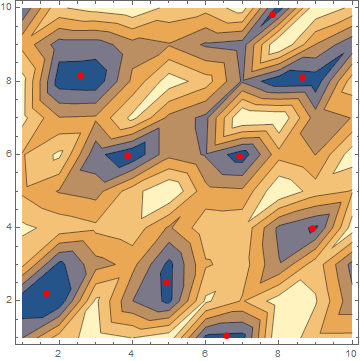
when you have multiple regions at the lowest level you'll need to manually take the 'last n' results from Cases:

plot = ListContourPlot[data, PlotLegends -> Automatic, Contours -> 5];
pts = RegionCentroid /@ 
   Cases[Normal@plot, Line[x_] :> Polygon[x], Infinity][[-9 ;;]];
Show[plot, Graphics[{Red, PointSize[.02], Point[pts]}]]

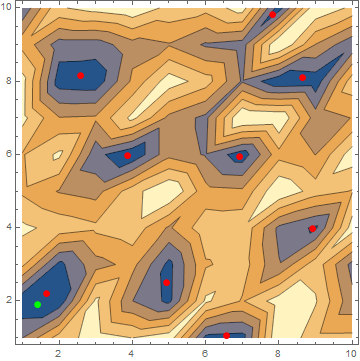
enter image description hereenter image description here

The green marker is the minimum for the interpolation function found by

Last@Quiet@
  FindMinimum[
   Interpolation[Flatten[MapIndexed[{#2, #} &, data, {2}], 1], 
     InterpolationOrder -> 3][x, y], {x, y}]

as you see its a little different.

plot = ListContourPlot[RandomReal[1, {10, 10}], 
   PlotLegends -> Automatic, Contours -> 5];
p1 = RegionCentroid[
   Cases[Normal@plot, Line[x_] :> Polygon[x], Infinity][[-1]]];
Show[plot, Graphics[{Red, PointSize[.02], Point[p1]}]]

enter image description here

when you have multiple regions at the lowest level you'll need to manually take the 'last n' results from Cases:

plot = ListContourPlot[data, PlotLegends -> Automatic, Contours -> 5];
pts = RegionCentroid /@ 
   Cases[Normal@plot, Line[x_] :> Polygon[x], Infinity][[-9 ;;]];
Show[plot, Graphics[{Red, PointSize[.02], Point[pts]}]]

enter image description here

data = RandomReal[1, {10, 10}];

plot = ListContourPlot[data, PlotLegends -> Automatic, Contours -> 5];
p1 = RegionCentroid[
   Cases[Normal@plot, Line[x_] :> Polygon[x], Infinity][[-1]]];
Show[plot, Graphics[{Red, PointSize[.02], Point[p1]}]]

enter image description here

when you have multiple regions at the lowest level you'll need to manually take the 'last n' results from Cases:

plot = ListContourPlot[data, PlotLegends -> Automatic, Contours -> 5];
pts = RegionCentroid /@ 
   Cases[Normal@plot, Line[x_] :> Polygon[x], Infinity][[-9 ;;]];
Show[plot, Graphics[{Red, PointSize[.02], Point[pts]}]]

enter image description here

The green marker is the minimum for the interpolation function found by

Last@Quiet@
  FindMinimum[
   Interpolation[Flatten[MapIndexed[{#2, #} &, data, {2}], 1], 
     InterpolationOrder -> 3][x, y], {x, y}]

as you see its a little different.
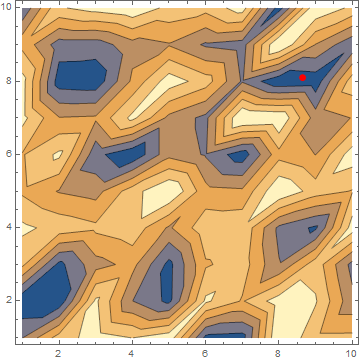
added 441 characters in body
Source Link
george2079
  • 39.1k
  • 1
  • 44
  • 111
plot = ListContourPlot[RandomReal[1, {10, 10}], 
   PlotLegends -> Automatic, Contours -> 5];
p1 = RegionCentroid[
   Cases[Normal@plot, Line[x_] :> Polygon[x], Infinity][[-1]]];
Show[plot, Graphics[{Red, PointSize[.02], Point[p1]}]]

enter image description hereenter image description here

when you have multiple regions at the lowest level you'll need to manually take the 'last n' results from Cases:

plot = ListContourPlot[data, PlotLegends -> Automatic, Contours -> 5];
pts = RegionCentroid /@ 
   Cases[Normal@plot, Line[x_] :> Polygon[x], Infinity][[-9 ;;]];
Show[plot, Graphics[{Red, PointSize[.02], Point[pts]}]]

enter image description here

plot = ListContourPlot[RandomReal[1, {10, 10}], 
   PlotLegends -> Automatic, Contours -> 5];
p1 = RegionCentroid[
   Cases[Normal@plot, Line[x_] :> Polygon[x], Infinity][[-1]]];
Show[plot, Graphics[{Red, PointSize[.02], Point[p1]}]]

enter image description here

plot = ListContourPlot[RandomReal[1, {10, 10}], 
   PlotLegends -> Automatic, Contours -> 5];
p1 = RegionCentroid[
   Cases[Normal@plot, Line[x_] :> Polygon[x], Infinity][[-1]]];
Show[plot, Graphics[{Red, PointSize[.02], Point[p1]}]]

enter image description here

when you have multiple regions at the lowest level you'll need to manually take the 'last n' results from Cases:

plot = ListContourPlot[data, PlotLegends -> Automatic, Contours -> 5];
pts = RegionCentroid /@ 
   Cases[Normal@plot, Line[x_] :> Polygon[x], Infinity][[-9 ;;]];
Show[plot, Graphics[{Red, PointSize[.02], Point[pts]}]]

enter image description here

Source Link
george2079
  • 39.1k
  • 1
  • 44
  • 111

plot = ListContourPlot[RandomReal[1, {10, 10}], 
   PlotLegends -> Automatic, Contours -> 5];
p1 = RegionCentroid[
   Cases[Normal@plot, Line[x_] :> Polygon[x], Infinity][[-1]]];
Show[plot, Graphics[{Red, PointSize[.02], Point[p1]}]]

enter image description here