I have noticed that OutputResponse seems to give the wrong result in certain circumstances. I've created a toy example to compare the results obtained with Mathematica (which seems wrong) with the ones obtained with Matlab (which seems correct).
This is the code for the toy example:
R1 = 56*^3;
C1 = 680*^-12;
RCfilter = TransferFunctionModel[1/(1 + s R1 C1), s];
freq = 200/3;
inputSignal[t_] := TriangleWave[t *freq];
T1 = .02;
output = OutputResponse[RCfilter, inputSignal[t], {t, 0, T1}];
output2 =
  OutputResponse[SystemsModelSeriesConnect[RCfilter, RCfilter],
   inputSignal[t], {t, 0, T1}];
output3 =
  OutputResponse[
   SystemsModelSeriesConnect[RCfilter,
    SystemsModelSeriesConnect[RCfilter, RCfilter]],
   inputSignal[t], {t, 0, T1}];
Plot[{inputSignal[t], output, output2, output3}, {t, 0, T1},
 PlotRange -> All]
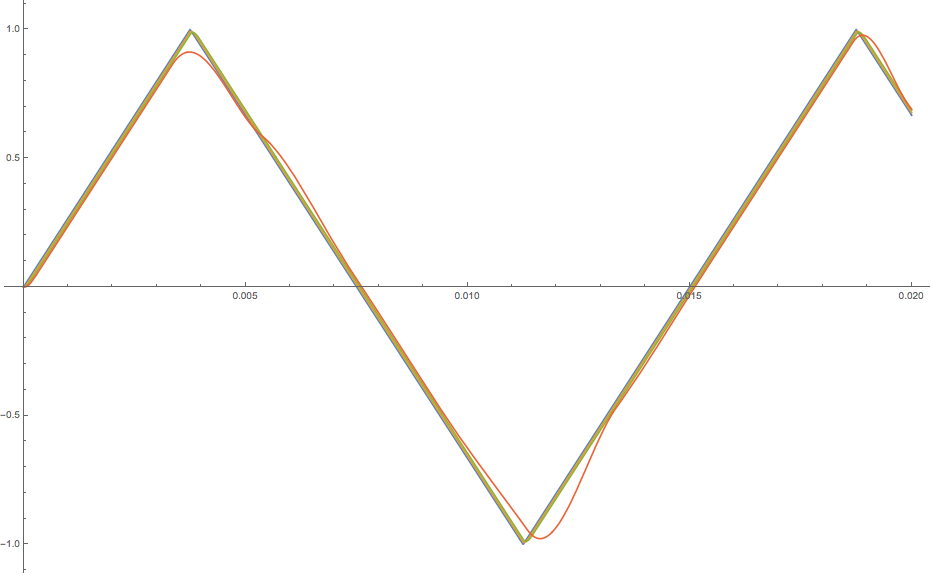
And this is the corresponding output:
output and output2 look correct, but output3, orange in the picture, seems not.
This is the same example in Matlab:
s=tf('s');

R1=56e3;
C1=680e-12;
Hrc = 1/(1+s*R1*C1);

H = series(series(Hrc, Hrc), Hrc);

T = 1e-6;
tEnd = 0.02;
F = 200/3;
t = 0:T:tEnd;
u = sawtooth(t*2*pi*F + pi/2, 0.5);

figure;
plot(t,u);

figure;
lsim(H,u,t)
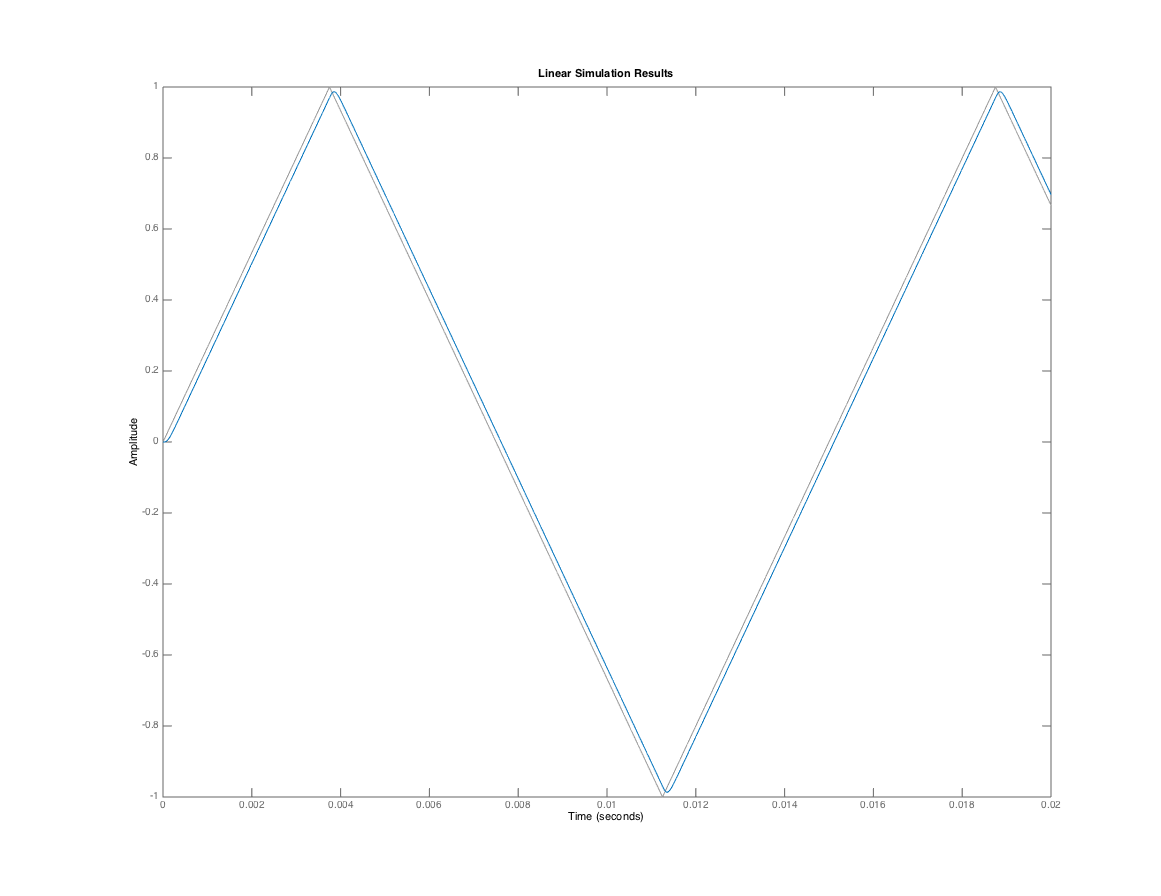
And this is the output (the blue line corresponds to output3 in the Mathematica code):
I'm using Mathematica 11.0.1 and Matlab R2014b. What am I doing wrong?


