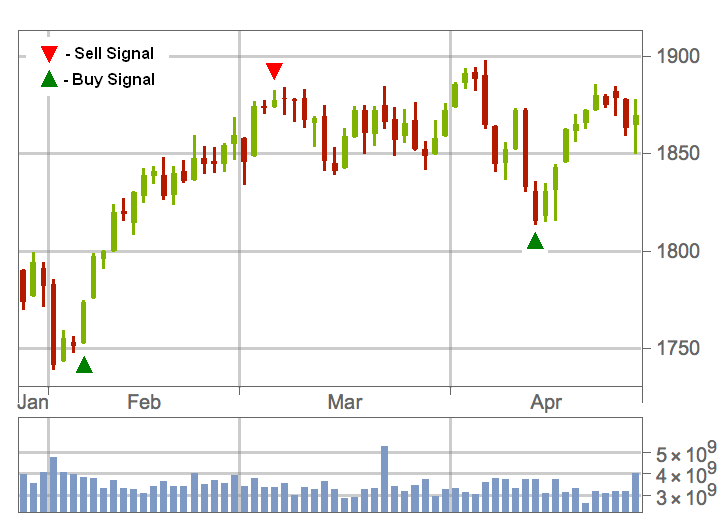
To visually evaluate a backtester, I would like to overlay "buy" and "sell" signals on TradingChart, while preserving the interactive functionality of TradingChart (hence no GraphicsColumn), using different colors of GridLines on a DateListPlot would have been a solution, but this doesn't have the necessary interactivity of TradingChart.
$\begingroup$
$\endgroup$
4
-
$\begingroup$ Is this a feature request or a question on how to implement this? If it is a feature request, please contact Wolfram: wolfram.com/support/contact Take a look at Scope -> Labeling in the documentation page of this function, it may be useful. $\endgroup$– SzabolcsCommented Nov 8, 2016 at 10:54
-
$\begingroup$ I didn't know about Labeling, this might work, I will try. $\endgroup$– Jerome IbanesCommented Nov 8, 2016 at 13:19
-
$\begingroup$ yeah I'm very happy with Labeling Events, thank you. $\endgroup$– Jerome IbanesCommented Nov 8, 2016 at 17:36
-
$\begingroup$ @JeromeIbanes please consider posting an answer then $\endgroup$– KubaCommented Nov 15, 2016 at 9:54
Add a comment
|
1 Answer
$\begingroup$
$\endgroup$
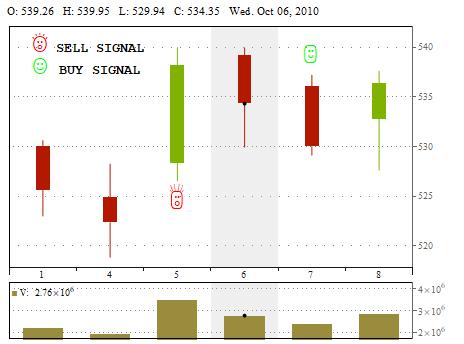
Wrap selected data points Labeled and wrap TrandingChart with Legended:
Legended[TradingChart[{{{2010, 10, 1}, {530.`, 530.62`, 523.`,   525.62`, 2225000}},
  {{2010, 10, 4}, {524.95`, 528.25`, 518.85`, 522.35`, 1940500}},
   Labeled[{{2010, 10, 5}, {528.38`, 540.`, 526.55`, 538.23`,  3507100}},
    Style["\[FreakedSmiley]", 30, Red], Below],
  {{2010, 10, 6}, {539.26`, 539.95`, 529.94`, 534.35`, 2762300}},
   Labeled[{{2010, 10, 7}, {536.1`, 537.2`, 529.14`, 530.01`, 2395800}},
    Style["\[HappySmiley]", 30, Green], Above],
  {{2010, 10, 8}, {532.77`, 537.6`, 527.62`, 536.35`, 2859200}}}],
 Placed[Grid[{{Style["\[FreakedSmiley]", 30, Red], Style["SELL SIGNAL", 16,  Bold]},
 {Style["\[HappySmiley]", 30, Green], Style["BUY SIGNAL", 16,  Bold]}}], {.2, .85}]]


