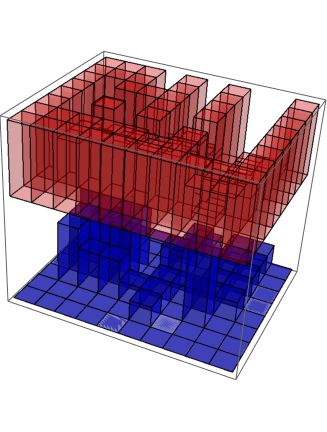
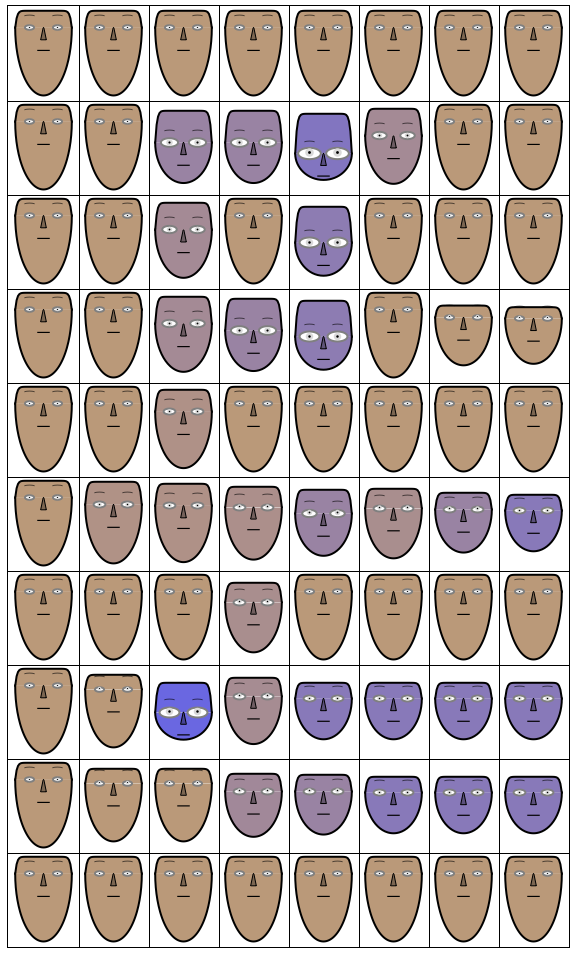
It's easy to present a terrain using BarChart3D using ChartLayout -> "Grid"with the following code:
terrain = {{10, 10, 10, 10, 10, 10, 10, 10}, {10, 10, 6, 6, 4, 7, 10,
    10}, {10, 10, 7, 10, 5, 10, 10, 10}, {10, 10, 7, 6, 5, 10, 2,
    1}, {10, 10, 8, 10, 10, 10, 10, 10}, {10, 9, 8, 6, 4, 5, 2,
    1}, {10, 10, 10, 5, 10, 10, 10, 10}, {10, 6, 1, 4, 1, 1, 1,
    1}, {10, 6, 6, 3, 2, 1, 1, 1}, {10, 10, 10, 10, 10, 10, 10, 10}};
BarChart3D[terrain, ChartLayout -> "Grid",
 Method -> {"Canvas" -> None}, ColorFunction -> "TemperatureMap",
 BoxRatios -> {7, 10, 3}, ChartStyle -> [email protected],
 ViewPoint -> {1.3, 1.2, 4.}, ImageSize -> 300, PlotRange -> {0, 10}]
It's also easy to present the height of the water flowing on this terrain by a similar code:
water = {{0, 0, 0, 0, 0, 0, 0, 0}, {0, 0, 3, 3, 5, 2, 0, 0}, {0,
    0, 2, 0, 4, 0, 0, 0}, {0, 0, 2, 3, 4, 0, 0, 0}, {0, 0, 1, 0, 0, 0,
     0, 0}, {0, 1, 1, 1, 2, 1, 1, 1}, {0, 0, 0, 1, 0, 0, 0, 0}, {0, 0,
     4, 1, 1, 1, 1, 1}, {0, 0, 0, 1, 1, 1, 1, 1}, {0, 0, 0, 0, 0, 0,
    0, 0}};
BarChart3D[water, ChartLayout -> "Grid",
 Method -> {"Canvas" -> None}, ColorFunction -> "TemperatureMap",
 BoxRatios -> {7, 10, 3}, ChartStyle -> [email protected],
 ViewPoint -> {1.3, 1.2, 4.}, ImageSize -> 300, PlotRange -> {0, 10}]
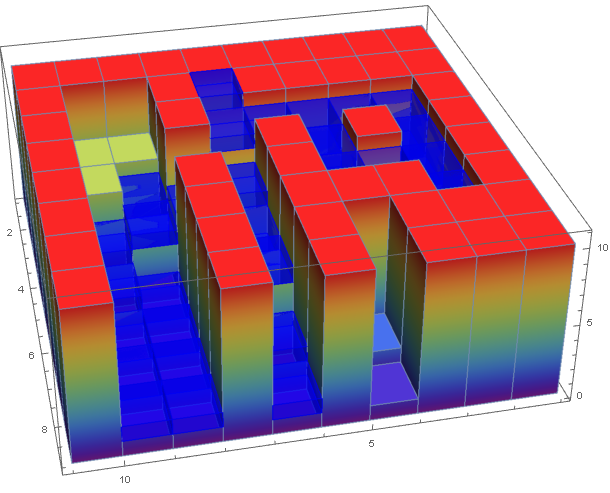
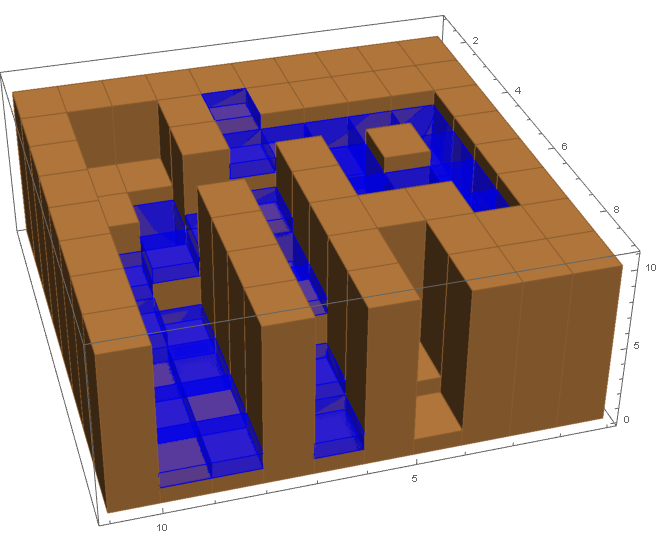
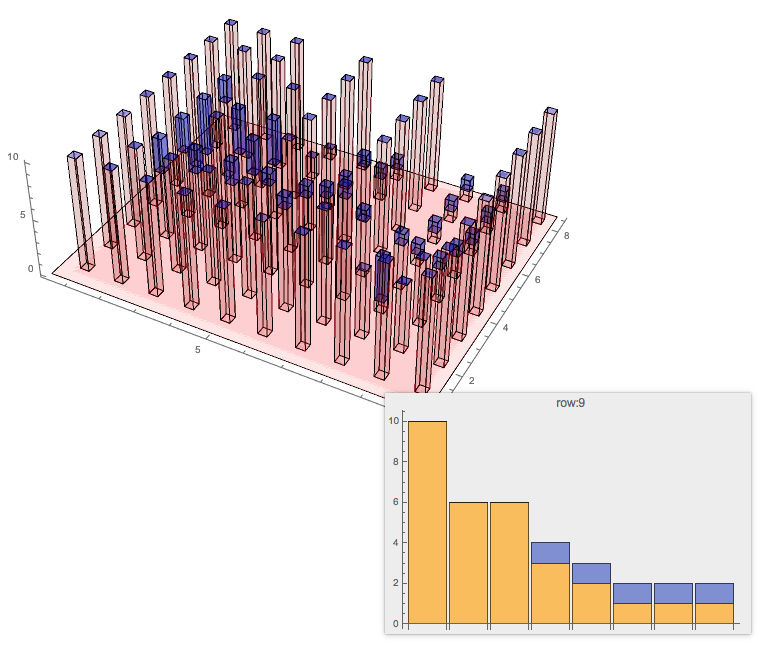
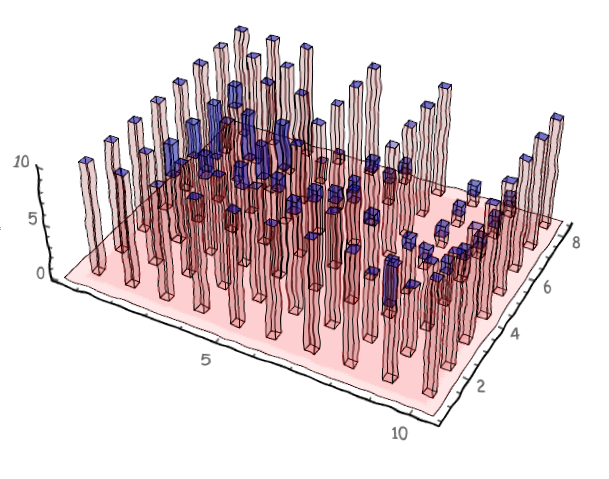
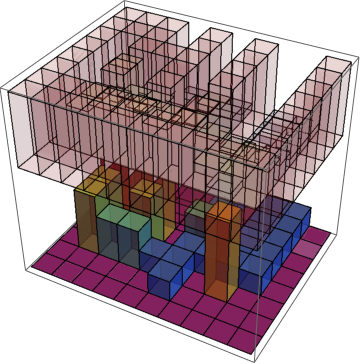
But I would love to have a graph that shows both information: The terrain shall lay below the waterflow with 100% opacity. They should be colored just like the first code do. However, the water shall have a 30% opacity and colored blue. In this way, we can get the information of terrain as well as water elegantly in one chart with one glimpse.
However, ChartLayout->"Stacked" can put different layers together, but only in 2-D format, while ChartLayout->"Grid" cannot stack different layers. Their simple combination won't work too.
So, put it simple, my question is: how can we "Stack" a "Grid" using BarChart3D?
Thanks!
Edit
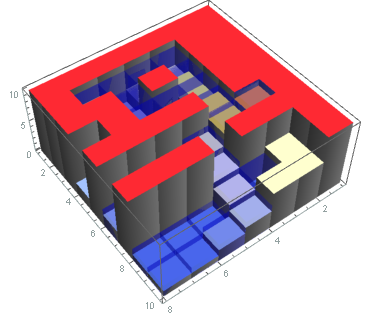
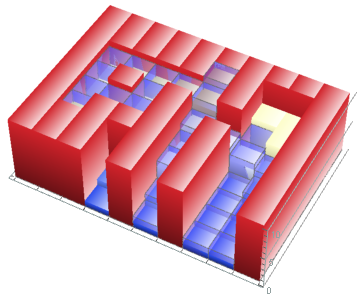
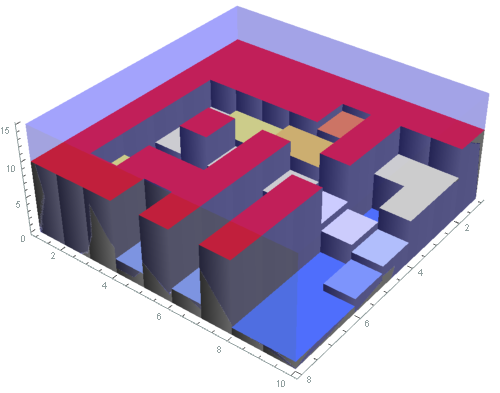
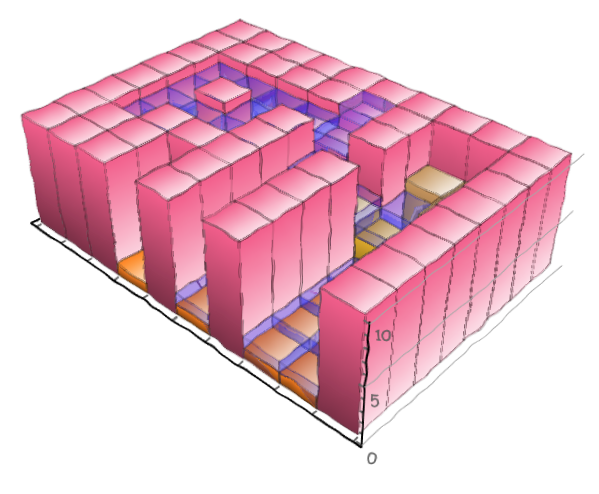
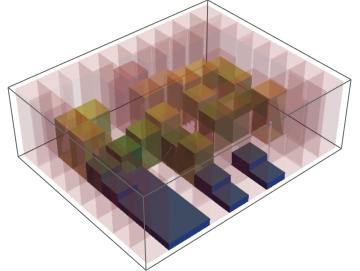
Actually I would love to put the water "on" the terrain, so it should look like the following picture, but terrain and water shall have different color:
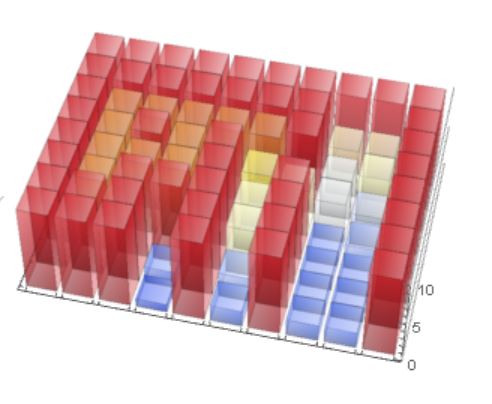
I gave out an solution in my answer, but I would still love to have one using mainly BarChart3D cause it is a more direct form I think.
Update2
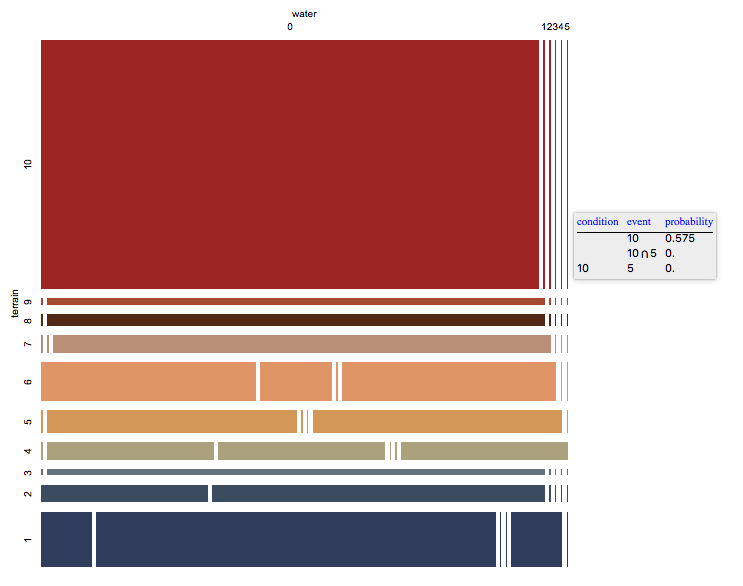
Thanks everyone for providing so many elegant solution, so there's only one question left:
As you can see, Using "Grid" layout we can get a 2D+height.graph. Meanwhile, using "Stacked" layout we can get stacked result. But why there're no easy way to use them together? It seems that this will not be a hard work for Wolfram as both functionality already exist......

