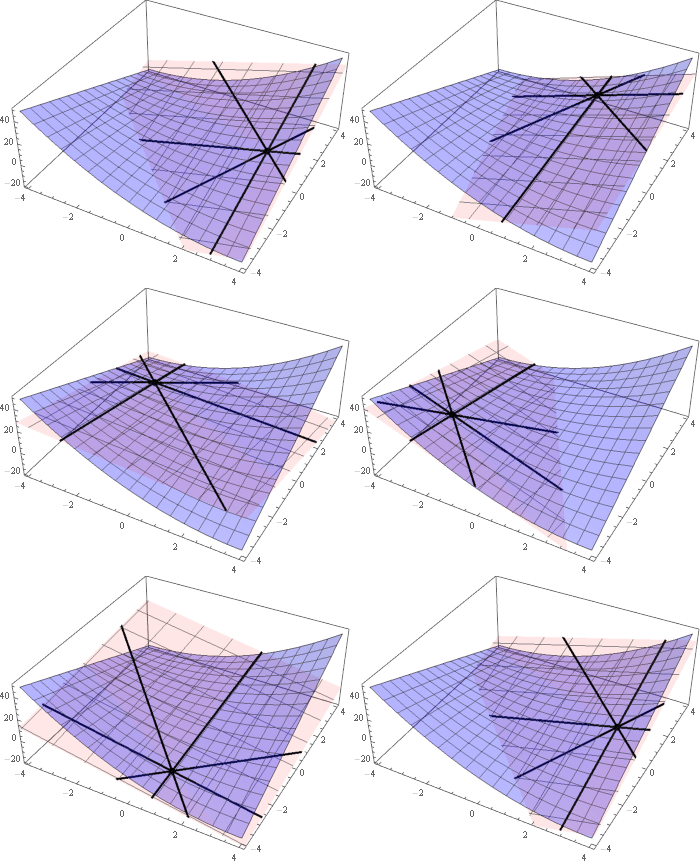
First of all, a little bit of theory here.
After that it's just typing it in.
Here is a version, where you can drag the point to wherever you want.
It uses, Plot3D for your surface, Graphics3D with InfiniteLine to draw the lines and a ParametricPlot3D to draw the tangent-plane.
Slider2D[Dynamic[p],{{-4,-4},{4,4}}]
Dynamic[
dx=p[[1]];dy=p[[2]];
anchorPoint={dx,dy,dx^2+2*dx*dy};
anchorRules=MapThread[Rule,{{x,y,z},anchorPoint}];
xsol=(D[{x,y,(x^2+2*x*y)},x]/.anchorRules);
ysol=(D[{x,y,(x^2+2*x*y)},y]/.anchorRules);
Show[
Plot3D[x^2+2*x*y,{x,-4,4},{y,-4,4},PlotStyle->Opacity[0.3,Blue],ImageSize->900],
Graphics3D[{Black,PointSize[Large],Point[anchorPoint],Thick,InfiniteLine[{anchorPoint,anchorPoint+xsol}],InfiniteLine[{anchorPoint,anchorPoint+ysol}],InfiniteLine[{anchorPoint,anchorPoint+ysol+xsol}],InfiniteLine[{anchorPoint,anchorPoint+ysol-xsol}]}],
ParametricPlot3D[anchorPoint+x*xsol+y*ysol,{x,-10,10},{y,-10,10},PlotStyle->Opacity[0.1,Red]]
,PlotRange->{{-4,4},{-4,4},{-20,50}}]
]
Or animated:

With InfinitePlane as suggested by J.M. in the comments:
Slider2D[Dynamic[p], {{-4, -4}, {4, 4}}]
Dynamic[dx = p[[1]]; dy = p[[2]];
 anchorPoint = {dx, dy, dx^2 + 2*dx*dy};
 anchorRules = MapThread[Rule, {{x, y, z}, anchorPoint}];
 xsol = (D[{x, y, (x^2 + 2*x*y)}, x] /. anchorRules);
 ysol = (D[{x, y, (x^2 + 2*x*y)}, y] /. anchorRules);
 Show[Plot3D[x^2 + 2*x*y, {x, -4, 4}, {y, -4, 4},
   PlotStyle -> Opacity[0.3, Blue], ImageSize -> 900],
  Graphics3D[{Black, PointSize[Large], Point[anchorPoint], Thick,
    InfiniteLine[{anchorPoint, anchorPoint + xsol}],
    InfiniteLine[{anchorPoint, anchorPoint + ysol}],
    InfiniteLine[{anchorPoint, anchorPoint + ysol + xsol}],
    InfiniteLine[{anchorPoint, anchorPoint + ysol - xsol}],
    Opacity[0.2, Red],
    InfinitePlane[{anchorPoint, anchorPoint + xsol,
      anchorPoint + ysol}]}],
  PlotRange -> {{-4, 4}, {-4, 4}, {-20, 50}}]]

