1
$\begingroup$

I intended to plot two 3D volumes of two spheres, each centered around $(x_0,y_0,z_0)$ and $(x_1,y_1,z_1)$, respectively. Here the reference points must be selected as $x_0+y_0+z_0=1$ and $x_1+y_1+z_1=1$ and $x_1,x_0,y_1,y_0,z_1,z_0>0$. For example $x_0=0.5$, $y_0=0.3$, $z_0=0.2$. The radiuses of each shperes must be selected such that the shperes dont overlap.

Then in the same plot I need to apply the constraint that the points must add upto $1$, i.e. $x+y+z=1$ and all these points $(x,y,z)$ must also be positive. This constraint will give triangle surfaces (if not volumes) in the spheres.

I want to use Opacity so that I can see both the spheres as well as the surfaces inside the spheres.

Lastly, an arrow from the center point of each sphere to its boundary labeled by $\epsilon_0$ and $\epsilon_1$.

I have an unsuccesful attempt as follows.

x0 = 0.5;
y0 = 0.3;
z0 = 0.2;
eps0 = .2;
mySphere = Graphics3D[{Opacity[0.5], Sphere[{x0, y0, z0}, .2]}, PlotRange -> {{-1, 1}, {-1, 1}, {-1, 1}}];
g1 = ContourPlot3D[x + y + z == 1, {x, 0, 1}, {y, 0, 1}, {z, 0, 1}, Mesh -> None]

x1 = 0.1;
y1 = 0.3;
z1 = 0.6;
eps1 = .3;

mySphere2 = Graphics3D[{Opacity[0.5], Sphere[{x1, y1, z1}, .3]}, PlotRange -> {{-1, 1}, {-1, 1}, {-1, 1}}];
Show[mySphere, g1, mySphere2, Axes -> True, AxesOrigin -> {0, 0, 0}, PlotRange -> {{-.5, 1}, {-.5, 1}, {-.5, 1}}, ViewPoint -> {1.55, -1.94, 2}]
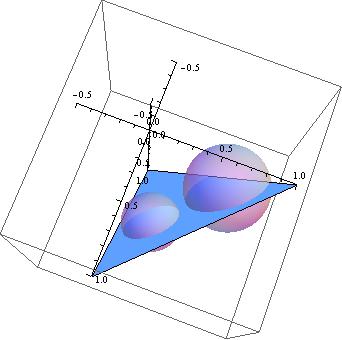
enter image description here

After Updating the question with the given answer. What remains is that myplane is I think correct for g1 as above (the triangle) but it must be restricted to each sphere. Namely myplane1 needs to stay in the first sphere and myplane2 needs to stay in the second sphere. There musnt be any plane outside the shperes. One last thing, if it could be possible to put an arrow?

The problem is that RegionPlot3D is very ugly. I dont wanna mesh grids on the shpere and Opacity is of no help. Not the whole trianglelike surface must be plotted. Only the part which lies in the sphere.

Can you help me to do this?

$\endgroup$

2 Answers 2

3
$\begingroup$

I think your question/request is:

Plot two non-intersecting semi-transparent spheres whose centers lie on the plane P defined by x + y + z = 1, as well as P restricted to the interiors of the spheres, all in the positive octant. Also add a labeled arrow from the center to the surface of each sphere.

If so, here's your solution:

center1 = {.5, .3, .2};
radius1 = .3;
center2 = {.1, .2, .7};
radius2 = .2;

mySphere1 = 
  Graphics3D[{Opacity[0.5], Sphere[center1, radius1]}, 
   PlotRange -> {{-.2, 1}, {-.2, 1}, {-.2, 1}}];
mySphere2 = 
  Graphics3D[{Opacity[0.5], Sphere[center2, radius2]}, 
   PlotRange -> {{-.2, 1}, {-.2, 1}, {-.2, 1}}];

myPlane = 
  Plot3D[1 - x - y, {x, 0, 1}, {y, 0, 1}, 
   RegionFunction -> 
    Function[{x, y, z}, If[x > 0 \[And] y > 0 \[And] z > 0 \[And]
       (Norm[{x, y, z} - center1] < radius1 \[Or] 
         Norm[{x, y, z} - center2] < radius2), True, False]],
   Mesh -> None,
   PlotStyle -> Opacity[0.9],
   PlotRange -> {{-.2, 1.5}, {-.2, 1.5}, {-.2, 1.5}},
   ClippingStyle -> None];

myArrow1 = Graphics3D[
   {Red, Arrow[{center1, center1 + radius1 Normalize[{1, 1, 1}]}]}];
myArrow2 = Graphics3D[
   {Red, Arrow[{center2, center2 + radius2 Normalize[{1, 1, 1}]}]}];

myLabel1 = 
  Graphics3D[
   Text[Style["\!\(\*SubscriptBox[\(\[Epsilon]\), \(1\)]\)", 16, Red],
     center1 + 1.2 radius1 Normalize[{1, 1, 1}] ]];
myLabel2 = 
  Graphics3D[
   Text[Style["\!\(\*SubscriptBox[\(\[Epsilon]\), \(2\)]\)", 16, Red],
     center2 + 1.3 radius2 Normalize[{1, 1, 1}] ]];

myfig = Show[mySphere1, mySphere2, myPlane, myArrow1, myArrow2, 
  myLabel1, myLabel2,
  Axes -> True, AxesOrigin -> {0, 0, 0}, 
  PlotRange -> {{-.2, 1}, {-.2, 1}, {-.2, 1}}, 
  ViewPoint -> {2.8, -2.8, 2}] 

enter image description here

$\endgroup$
7
  • $\begingroup$ I am sorry. My code is only for one sphere but what I need is two. Since at one I was away from what I needed to have, I didnt try more. $\endgroup$ Commented Jan 7, 2015 at 3:11
  • $\begingroup$ Okay I checked it. except for myplane everything is fine. myplane has the term 1-x-y and this becomes negative for some $x$ and $y$. with the constraint, but for $x+y+z=1$, we also need to have $x>0$, $y>0$ and $z>0$. Mysphere is nice as I wanted. I worked out with your answer and I am updating the question now with only a few missing points. $\endgroup$ Commented Jan 7, 2015 at 3:45
  • $\begingroup$ Thank you very much for your help. It is very beautiful now. Only one more remaning point and the mission is completed. Just after the two arrow heads I would like to put $\epsilon_0$ and $\epsilon_1$, respectively. This is actually written in the question. On the other hand, I always accept the answers, pls have a look at my profile history. Thanks once again. $\endgroup$ Commented Jan 8, 2015 at 1:16
  • 1
    $\begingroup$ The placement of the label is a trivial modification of the code. I'll do it, but you should be able to make such a trivial alteration on your own. $\endgroup$ Commented Jan 8, 2015 at 1:18
  • $\begingroup$ I did the labeling already for $x,y,z$ axes and also I changes a few more things. What remains is only those after the red arrows just after the heads of arrows. $\endgroup$ Commented Jan 8, 2015 at 1:20
2
$\begingroup$

Using

{c0, c1} = {{.5, .3, .2}, {.1, .2, .7}};
{r0, r1} = {.3, .2};
{l0, l1} = Style[Subscript["\[Epsilon]", #],Red,16] & /@ {"0", "1"};
s = {{c0, r0, l0}, {c1, r1, l1}};

(a) You can use RegionFunction in your g1 to incorporate the constraints:

g1 = ContourPlot3D[x + y + z == 1, {x, 0, 1}, {y, 0, 1}, {z, 0, 1}, 
   ContourStyle -> Directive[Opacity[.7], Orange], Mesh -> None,
   RegionFunction -> Function[{x, y, z}, Or@@(Total[({x, y, z} - #)^2] <= #2^2 & @@@ s)]];

(b) You can have all your graphics primitives in a single Graphics3D:

Graphics3D[{g1[[1]], {Opacity[.3], LightBlue, Sphere[#, #2],
   Opacity[1], Red, Arrow[{#, # + #2/Sqrt[3]}], Text[#3, 0.05 {1, 1, 1} + # + #2/Sqrt[3]]}&@@@ s},
  PlotRange -> {{-.5, 1}, {-.5, 1}, {-.5, 1}}, ViewPoint -> {1.55, -1.94, 2}]

enter image description here

$\endgroup$
2
  • $\begingroup$ thank you very much for the answer. I just saw. $\endgroup$ Commented Jan 12, 2015 at 0:23
  • $\begingroup$ @Seyhmus, my pleasure.. $\endgroup$
    – kglr
    Commented Jan 12, 2015 at 0:35

Your Answer

By clicking “Post Your Answer”, you agree to our terms of service and acknowledge you have read our privacy policy.

Not the answer you're looking for? Browse other questions tagged or ask your own question.