1
$\begingroup$

I have obtained the following equations from Wolfram documentation.

sol = First[ 
   NDSolve[{x'[t] == (1/4) x[t - τ]/ (1 + x[t - τ]^10) - 
       x[t]/10, x[t /; t <= 0] == 1/2}, x, {t, 0, 5000}, 
    MaxSteps -> ∞]];

solrk = First[ 
   NDSolve[{x'[t] == (1/4) x[t - τ]/ (1 + x[t - τ]^10) - 
       x[t]/10, x[t /; t <= 0] == 1/2}, x, {t, 0, 5000}, 
    MaxSteps -> ∞, 
    Method -> {"ExplicitRungeKutta", "DifferenceOrder" -> 3}]];
ListPlot[Table[{t, RealExponent[(x[t] /. sol) - (x[t] /. solrk)]}, {t, 17, 5000, 17}]]

The same equation has been solved twice using two different methods and RealExponent[d] has been plotted with respect to time. Here d is the difference between x[t] computed by the different methods.

My question is How to plot RealExponent[d] with respect to τ, where τ can be varied from 14 to 40.

$\endgroup$
0

1 Answer 1

1
$\begingroup$

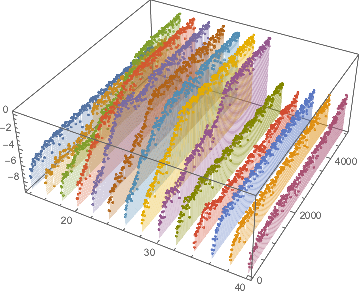
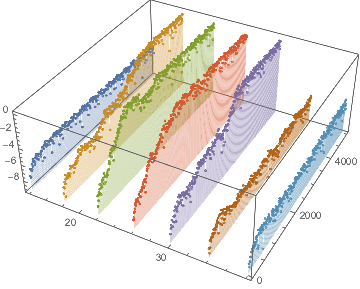
This is basically what I think you're looking for. The RealExponent of the difference is stored in red as a list of triples {τ, t, d}.

Clear[x, t, τ, sol, solrk]

sol[τ_] := Block[{t, x},  (* so  Table[]  doesn't overwrite  t  *)
   sol[τ] =               (* remember the solution so that it won't be recomputed *)
    First[NDSolve[{x'[t] == (1/4) x[t - τ]/(1 + x[t - τ]^10) - x[t]/10, 
       x[t /; t <= 0] == 1/2}, x, {t, 0, 5000}, 
      MaxSteps -> ∞]]
   ];

solrk[τ_] := Block[{t, x},
   solrk[τ] = 
    First[NDSolve[{x'[t] == (1/4) x[t - τ]/(1 + x[t - τ]^10) - x[t]/10, 
       x[t /; t <= 0] == 1/2}, x, {t, 0, 5000}, 
      MaxSteps -> ∞, Method -> {"ExplicitRungeKutta", "DifferenceOrder" -> 3}]]
   ];

red = Table[{τ, t, RealExponent[(x[t] /. sol[τ]) - (x[t] /. solrk[τ])]},
   {τ, 14, 40, 4}, {t, 17, 5000, 17}];

ListPointPlot3D[red, Filling -> Bottom]

The right plot is with a Δτ in Table[] of 2.

$\endgroup$
6
  • $\begingroup$ Thank you for this response. In the 2nd plot did you take more steps? Can I ask for a 2D diagram only RealExponent and τ. $\endgroup$
    – Udichi
    Commented Sep 25, 2016 at 14:32
  • $\begingroup$ @Udichi Change the 4 to a 2 in the Table for red, to get the plot on the right. -- What do you mean 2D? You could plot Table[{τ, RealExponent[d]},...], but I think the result will be a bunch of dots basically filling in a vertical line segment for for each value of τ. Is that what you want? $\endgroup$
    – Michael E2
    Commented Sep 25, 2016 at 14:55
  • $\begingroup$ I have used the command ListPlot[Table[{[Tau], RealExponent[(x[t] /. sol[[Tau]]) - (x[t] /. solrk[[Tau]])]}, {[Tau], 14, 40, 4}]], but not getting any result. What mistake is there $\endgroup$
    – Udichi
    Commented Sep 25, 2016 at 15:10
  • $\begingroup$ @Udichi I get this: i.sstatic.net/Hu55D.png, which is what I expected. $\endgroup$
    – Michael E2
    Commented Sep 25, 2016 at 15:16
  • $\begingroup$ Thank you for your help. Thank you very much $\endgroup$
    – Udichi
    Commented Sep 25, 2016 at 15:30

Your Answer

By clicking “Post Your Answer”, you agree to our terms of service and acknowledge you have read our privacy policy.

Not the answer you're looking for? Browse other questions tagged or ask your own question.