3
$\begingroup$

I have a hunch that this is a straightforward variant of similar questions regarding how functions are evaluated by Plot, but this case has me stumped. Let's say I want to produce a plot of the density of water as a function of temperature. So I define

DensWater[temp_] := 
 ThermodynamicData["Water", "Density", 
     {"Temperature" -> Quantity[temp, "DegreesCelsius"]}]

I can call this function with any value for T such as DensWater[25.0] and I receive a result with an attached unit as expected. However, when I try to plot this function using

Plot[DensWater[T], {T, 10., 65.}]

I get ThermodynamicData::quant: T is not a real number.

I did try various ways to get this resolved, but somehow can't get the Plot command to work without giving error messages. What's the trick?

P.S.: Just to be clear, the Plot command does provide a plot in the end, I'm just surprised by the error message.

Update:

The above is just a minor annoyance, but if I define a function of two variables, say pressure and temperature like so:

DensAir[T_, p_] := 
 ThermodynamicData["Air", "Density", 
    {"Temperature" -> Quantity[T, "DegreesCelsius"], "Pressure" -> Quantity[p, "Pascals"]}]

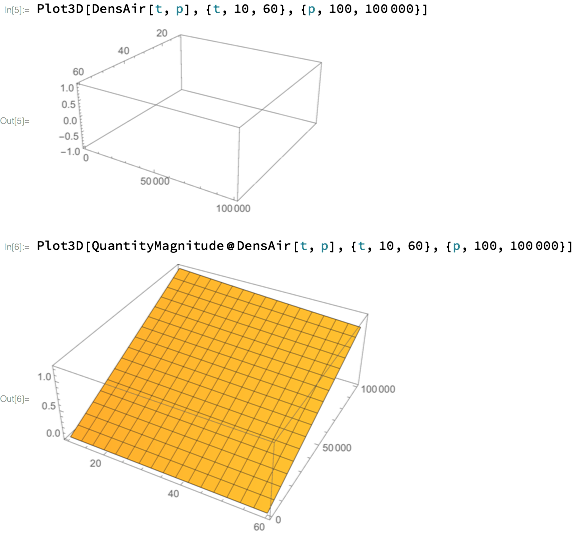
and try to plot this using Plot3D, I get an empty plot. When plotting 2D slices of the above function using Plotthis function works as above (with error messages, but giving a plot).

$\endgroup$
1
  • $\begingroup$ Worked in M10.4 Linux - no error message. $\endgroup$
    – Sumit
    Commented Aug 24, 2016 at 13:00

1 Answer 1

4
$\begingroup$

Whenever you get the "XXX is not a real number" type of error message, a method to get around the error is to put a constraint on the pattern when you define the function to ensure that only real numbers will be evaluated:

DensWater[temp_?NumericQ] := 
  ThermodynamicData["Water", 
   "Density", {"Temperature" -> Quantity[temp, "DegreesCelsius"]}];

You can see how this works via

DensWater[t]
DensWater[20.0]
(* DensWater[t] *)
(* Quantity[998.207, ("Kilograms")/("Meters")^3] *)

The first call does not get evaluated, because there's no pattern definition that matches. This fixes the error you get when you call Plot. One suggestion I have is that it's faster to make one call to the paclet for a list of temperatures than to repeatedly call the paclet for different temperatures. This gives your plot a bit faster (assuming you've quit the kernel, because ThermodynamicData caches the results),

DensWater[temp_?NumericQ | temp_List] := 
 ThermodynamicData["Water", 
  "Density", {"Temperature" -> Quantity[temp, "DegreesCelsius"]}]
ListLinePlot[DensWater[Range[10, 60]]]

Now about the second issue, I can't seem to get Plot3D to work with data that has units. Using the same method as above, with DensAir[T_?NumericQ, p_?NumericQ]:= ......, I get no error message but I still get no plot unless I strip the Quantity head,

enter image description here

This seems like a bug to me. Also, when I try to use the trick above for giving lists directly to ThermodynamicData in two dimensions I get "ThermodynamicData::time: Calculation exceeded time limit" errors.

$\endgroup$
0

Your Answer

By clicking “Post Your Answer”, you agree to our terms of service and acknowledge you have read our privacy policy.

Not the answer you're looking for? Browse other questions tagged or ask your own question.