9
$\begingroup$

Bug introduced in 10.0 or earlier and continuing through 11.3; Reported as CASE:3691952

I am trying to calculate and plot the sensitivity of a solution to some master equation using ParametricNDSolveValue[], but I'm unable to plot the derivative of the solution with respect to the parameter.

y[t_] = {y11[t], y12[t], y13[t], y21[t], y22[t], y23[t], y31[t], y32[t], y33[t]};
equations = 
  Table[(y'[t] - S1.y[t])[[j]] == 0, {j, 1, 9}] /. {Ω -> Γ3, Γ -> 1};
startConditions = 
  {y11[0] == 1/3, y12[0] == 0, y13[0] == 0, 
   y21[0] == 0, y22[0] == 1/3, y23[0] == 0, 
   y31[0] == 0, y32[0] == 0, y33[0] == 1/3};
system = Join[equations, startConditions];
solution = 
  ParametricNDSolveValue[system, y33[1], {t, 0, 1}, {δ, Γ3}, 
   MaxSteps -> ∞];
Plot[Evaluate[D[solution[δ, 1], δ]], {δ, -1, 1}]

where S1 is a $9\times9$ matrix whose elements contain the parameters δ, Ω Γ3, Γ:

S1 = {{0, 0, I Ω, 0, 0, 0, -I Ω, 0, Γ},
      {0, -Γ3 + 2 I δ, I Ω, 0, 0, 0, 0, -I Ω, 0},
      {I Ω, I Ω, -Γ + I δ, 0, 0, 0, 0, 0, -I Ω},
      {0, 0, 0, -Γ3 - 2 I δ, 0, I Ω, -I Ω, 0, 0},
      {0, 0, 0, 0, 0, I Ω, 0, -I Ω, Γ},
      {0, 0, 0, I Ω, I Ω, -Γ - I δ, 0, 0, -I Ω},
      {-I Ω, 0, 0, -I Ω, 0, 0, -Γ - I δ, 0, I Ω},
      {0, -I Ω, 0, 0, -I Ω, 0, 0, -Γ + I δ, I Ω},
      {0, 0, -I Ω, 0, 0, -I Ω, I Ω, I Ω, -2 Γ}};

The code plots nothing and also doesn't print any error message. The kernel autoquits when I try to plot. (Edit: Kernel no longer terminates in v11.2.)

Whereas:

Plot[Evaluate[solution[δ, 1]], {δ, -1, 1}]
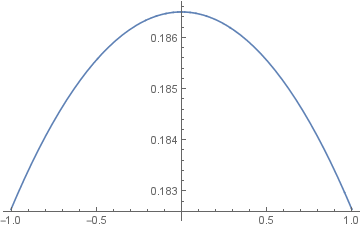
plot

Any suggestions?

$\endgroup$
7
  • $\begingroup$ Hard to say anything if you don't include S1. $\endgroup$ Commented Aug 14, 2016 at 8:17
  • $\begingroup$ You can now find your question under "Problem with plotting the derivative of a ParametricFunction", which is what I isolated as the problem. $\endgroup$
    – Feyre
    Commented Aug 14, 2016 at 9:05
  • $\begingroup$ @Feyre, Shahar: It is not plot-related, the problem manifests when you try to calculate: D[solution[δ, 1], δ] /. δ -> 1, and the kernel automatically quits. $\endgroup$ Commented Aug 14, 2016 at 9:17
  • $\begingroup$ @IstvánZachar I see, but Evaluate[D[solution[\[Delta], 1], \[Delta]]] runs fine for me, so it's actually extracting values from the Derivative function which causes the auto quit. $\endgroup$
    – Feyre
    Commented Aug 14, 2016 at 9:26
  • 2
    $\begingroup$ @Feyre Nevertheless, the calculation should terminate gracefully, and not with a kernel quit. It's always an indication of the lack of proper error handling internally. $\endgroup$ Commented Aug 14, 2016 at 10:05

2 Answers 2

6
$\begingroup$

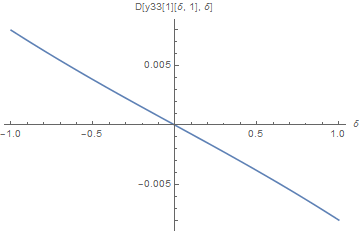
A straightforward but surprising approach is to specify WorkingPrecision -> $MachinePrecision (or most any other value) in ParametricNDSolveValue.

solution = ParametricNDSolveValue[system, y33[1], {t, 0, 1}, {δ, Γ3}, 
    WorkingPrecision -> $MachinePrecision];
Plot[Evaluate[D[solution[δ, 1], δ] // Chop], {δ, -1, 1}, 
    AxesLabel -> {δ, "D[y33[1][δ, 1], δ]"}]

enter image description here

This bizarre behavior certainly must be a bug.

Earlier workaround

A workaround is to differentiate the ODE system with respect to δ and then solve simultaneously for y and D[y[δ], δ]. This is accomplished by adding to the equations in the question the following.

dS1 = D[S1, δ];
dy[t_] = {dy11[t], dy12[t], dy13[t], dy21[t], dy22[t], dy23[t], dy31[t], dy32[t], dy33[t]};
dequations = Thread[(dy'[t] - S1.dy[t]) - dS1.y[t] == 0] /. {Ω -> Γ3, Γ -> 1};
dstartConditions = Thread[dy[0] == 0];
dsystem = Join[equations, dequations, startConditions, dstartConditions];
dsolution = ParametricNDSolveValue[dsystem, dy33[1], {t, 0, 1}, {δ, Γ3}];
Plot[dsolution[δ, 1], {δ, -1, 1}, AxesLabel -> {δ, "D[y33[1][δ, 1], δ]"}]

giving the same plot as above. This approach can be applied to general parametric ODE systems, although the fact that δ appears linearly in this ODE system is particularly convenient.

$\endgroup$
5
$\begingroup$

Here is a workaround:

Extract the values of the original function:

list = Table[{δ, solution[δ, 1]}, {δ, -1, 1,0.01}];

Interpolate, derivate, plot:

f = Interpolation[list];
df = D[f[x], x];
Plot[df, {x, -1, 1}]

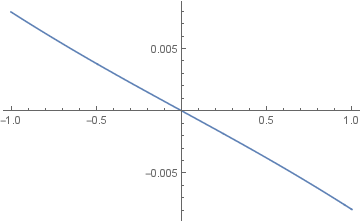
enter image description here

Where df closely approximates D[solution[δ, 1], δ]. As expected, the derivative is negative for $\delta <0$, and follows the form one might expect from the original plot.

$\endgroup$

Your Answer

By clicking “Post Your Answer”, you agree to our terms of service and acknowledge you have read our privacy policy.

Not the answer you're looking for? Browse other questions tagged or ask your own question.