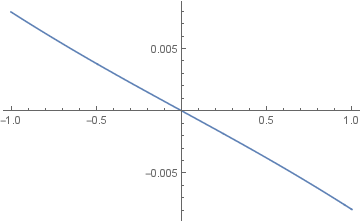
Here is a workaround:
Extract the values of the original function:
list = Table[{\[Delta]δ, solution[\[Delta]solution[δ, 1]}, {\[Delta]δ, -1, 1,0.01}];
Interpolate, derivate, plot:
f = Interpolation[list];
df = D[f[x], x];
Plot[df, {x, -1, 1}]
Where df closely approximates D[solution[δ, 1], δ].
As expected, the derivative is negative for $\delta <0$, and follows the form one might expect from the original plot.

