0
$\begingroup$

I would like to plot multiple sets of x and y data on the same plot with a legend. This is the code I am using right now:

y = Table[f[c1_,inc_], {c1, 0, 3, 0.1}, {inc, {0, 0.2, 0.4, 0.6}}];
x = Table[{c1 + c1 + inc}, {c1, 0, 3,  0.1}, {inc, {0, 0.2, 0.4, 0.6}}];

Each column of y corresponds to a set of y data and each column of x corresponds to a set of x data.

I would like to obtain a plot with multiple curves, ideally with a legend. Ideas?

$\endgroup$
2
  • $\begingroup$ May you edit your question and add the definition for f and show the code you have tried. $\endgroup$
    – Edmund
    Commented Apr 9, 2016 at 22:20
  • $\begingroup$ Two things are going to be required: first, learn to use the ListPlot function. Next, learn to manipulate the lists to achieve the form that needed in the plot function. $\endgroup$
    – bill s
    Commented Apr 10, 2016 at 1:46

1 Answer 1

1
$\begingroup$

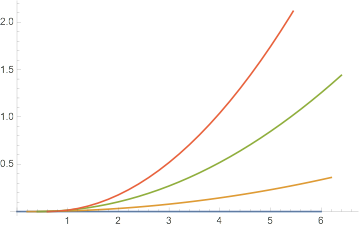
Here's a start. Since you declined to specify f[ ], I chose one.

f[x_, y_] := x^2 y^2; 
y = Table[{c1 + c1 + inc, f[c1, inc]}, {c1, 0, 3, 0.1}, {inc, {0, 0.2, 0.4, 0.6}}];
ListLinePlot[Transpose[y]]

enter image description here

$\endgroup$
7
  • $\begingroup$ Hi! Thank you very much this helped a lot. My function is a very large mathematica output so I don't think it would have been much help to you. Do you know how I could include a legend in the plot? $\endgroup$
    – MathJo
    Commented Apr 13, 2016 at 18:32
  • $\begingroup$ How about ListLinePlot[Transpose[y], PlotLegends -> Automatic] $\endgroup$
    – bill s
    Commented Apr 13, 2016 at 19:35
  • $\begingroup$ Hi! I get ListLinePlot::optx: Unknown option PlotLegends in <<1.>> $\endgroup$
    – MathJo
    Commented Apr 13, 2016 at 20:47
  • $\begingroup$ Maybe you are using an older version? $\endgroup$
    – bill s
    Commented Apr 13, 2016 at 22:39
  • $\begingroup$ HI! I figured it out. I had to load the package. Your code works well. I noticed for the higher inc, that I have data points for higher x values. For example, in your graph some lines terminate earlier than others. Is there some way I could have them terminate for the same x value? $\endgroup$
    – MathJo
    Commented Apr 14, 2016 at 14:29

Your Answer

By clicking “Post Your Answer”, you agree to our terms of service and acknowledge you have read our privacy policy.

Not the answer you're looking for? Browse other questions tagged or ask your own question.