23
$\begingroup$

I'm trying to measure a phase difference between two Sine functions I've acquired with a computer. I'm uploading one of the .txt files with the data I'm working with here: txt file. To remove the units of every row I'm using the function that @R.M posted here.

The first two columns of each file make a Sin function, the other columns make a different one. Here's a plot of those functions togheter:
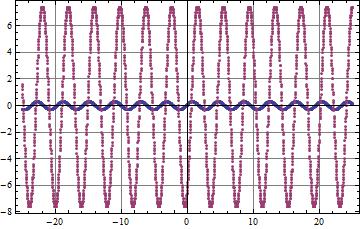
Two Sin functions with different pahses.

I'm looking for a way to find all rows that have a maximum value on the second coordinate (that is, second and fourth column) and then be able to manipulate those lists in order to get the difference between the other two coordinates. For example, if this are the two lists with the maximums:

max1={{1.1,6},{2.2,6},{3.3,6},{4.4,6}{5.5,6}}
max2={{1.3,10},{2.4,10}{3.5,},{4.6,10},{5.7,10}}

Then I could easily get the difference between the first coordinates of each pair (1.3-1.1, 2.4-2.2, etc.), which is what I need.

I have tried doing the proposed methods in this question but none of them worked for me.

Furthermore, I got a lot of files like this to analyze, so I'm importing all of them with a For loop and putting them all on the same list with Table. It would be nice if I could get the maximums of all my files at the same time.

I'll apreciate any ideas, thank you.

Ps.: By the way, by asking and reading the contents of this page I realized Mathematica is a much more powerful tool than I thought, and I would like to learn more about how to properly use it. I know the Mathematica documentation is really good, but I would like to get a good book about Mathematica. Do you know one to reccommend?

$\endgroup$
2
  • 1
    $\begingroup$ For links to good books and introductions to Mathematica, you might try starting here: mathematica.stackexchange.com/questions/18/… $\endgroup$
    – DavidC
    Commented Sep 24, 2012 at 20:00
  • $\begingroup$ Why don't you post your datafile already converted to a Mathematica list? $\endgroup$ Commented Sep 24, 2012 at 23:40

5 Answers 5

24
$\begingroup$

If what you really want to do is to find the phase difference between two digitized sinusoids of the same frequency, then there is probably a better way to proceed than by counting the peaks. You can take the Fourier transform of the two signals, and then look at the phase difference between them. For example, say the sine waves are:

s1 = Table[Sin[2 Pi 10 t], {t, -1, 2, 1/1000}];
s2 = Table[0.2 Sin[2 Pi 10 t + 0.8], {t, -1, 2, 1/1000}];
ListLinePlot[{s1, s2}]

So you can see this is qualitatively like your situation. I've arbitrarily assigned the second (smaller) sine wave to be 0.8 radians out of phase with the first. Let's take the FFTs and recover this from the data.

ffts1 = Fourier[s1, FourierParameters -> {-1, 1}];
ffts2 = Fourier[s2, FourierParameters -> {-1, 1}];
max = Max[Abs[ffts1]];
pos = First[First[Position[Abs[ffts1], max]]];
Arg[ffts1[[pos]]] - Arg[ffts2[[pos]]]

which gives the answer

0.800167
$\endgroup$
2
  • $\begingroup$ Thank you! I'm going to try this right away. $\endgroup$
    – Juan
    Commented Sep 24, 2012 at 20:39
  • $\begingroup$ Sorry for the late answer, this is just what I was looking for. Thank you very much. $\endgroup$
    – Juan
    Commented Sep 25, 2012 at 4:22
10
$\begingroup$

Sometimes Correlation is useful too:

l1 = Table[Sin[x] + RandomReal[1/10], {x, 0, 10 Pi, 1/20}];
l2 = 1/4 Table[Sin[x + 1/2] + RandomReal[1/15], {x, 0, 10 Pi, 1/20}];
ListPlot[{l1, l2}]

Mathematica graphics

And now:

h = IntegerPart[Length@l1/4]; 
lc = N@ListCorrelate[l1[[h - # ;; -h - #]], l2[[h ;; -h]]][[1]] & /@ Range[h - 1];
ListPlot[{RotateRight[l1, First@Ordering[lc] - 1], l2}]

Mathematica graphics

Edit

Running with your data:

Mathematica graphics

And the offset is

First@Ordering[lc] - 1
(*137 *)

or 2.74 μS

$\endgroup$
4
  • $\begingroup$ Correlation is great, but two comments apropos this solution: (1) You appear to have found the minimum correlation: the two datasets are completely out of phase in your images. Usually we want the maximum correlation. (2) Applying an interpolating function to each dataset will enable you automatically to pin down the phase shift to high precision. $\endgroup$
    – whuber
    Commented Sep 25, 2012 at 8:30
  • $\begingroup$ Thanks Whuber. Re:1) I use correlation this way because (and this is just an experimental result, I can't prove it) I usually find the minimum better defined than the maximum. 2) I don't quite understand why using interpolation on noisy data is a good thing, surely I'm missing something there. $\endgroup$ Commented Sep 25, 2012 at 13:19
  • $\begingroup$ I wasn't thinking of interpolating the data (although in retrospect I see it sounds like that), but rather wanted to suggest interpolating the correlogram. Your point about noise is a good one, regardless: the correlogram can usually be improved by first smoothing (or filtering) the data. There's a decent discussion of this in the appropriate Numerical Recipes chapter. $\endgroup$
    – whuber
    Commented Sep 25, 2012 at 21:03
  • $\begingroup$ @whuber Ah, Ok. Agree. I misunderstood you $\endgroup$ Commented Sep 25, 2012 at 21:46
10
$\begingroup$

A simple and fast method for finding the phase difference would be to do it manually. Let's plot the two data sets in a Manipulate and let one have a manually determined offset. Since the time bases in both lists are the same I discard them for the moment so that the x-axis depicts sample number:

Manipulate[
    ListLinePlot[{24.7 lists[[1, All, 2]], lists[[2, offset ;; -1, 2]]}, ImageSize -> 600], 
    {offset, 1, 400, 1}
]

Mathematica graphics

Note that I scaled one of the plots by 24.7 for reasons that will be made clear later on.

If you play with that you find that a 38 sample shift is about optimal.

How to do this with fourier analysis?

The amplitude spectra:

af1 = Abs@Fourier[lists[[1, All, 2]]];
af2 = Abs@Fourier[lists[[2, All, 2]]];

The phases:

pf1 = Arg@Fourier[lists[[1, All, 2]]];
pf2 = Arg@Fourier[lists[[2, All, 2]]];

A plot of the amplitude spectrum of the first sample:

ListLinePlot[af1, PlotRange -> All]

Mathematica graphics

The two peaks are at:

Ordering[af1, -2]

{14, 2488}

The same for the second sample. At position 14 the ratio of the amplitudes is:

af2[[14]]/af1[[14]]

24.70345393

So, here we have our amplitude scaling factor.

The phase difference for this peak is:

pf2[[14]] - pf1[[14]]

1.240647232

or in terms of sample positions:

(pf2[[14]] - pf1[[14]])/(2 \[Pi]) 1/((14.-1)/Length[af1])

37.97214223

Yes, the same value we found manually.

$\endgroup$
1
  • $\begingroup$ A good way of solving this, but I have a lot of lists (90 or so). Though I'm sure it will prove useful some time. $\endgroup$
    – Juan
    Commented Sep 25, 2012 at 4:23
9
$\begingroup$
Correlation[s1, s2] // ArcCos

Borrowing @bills definitions

s1 = N@Table[Sin[2 Pi 10 t], {t, -1, 2, 1/1000}];
s2 = N@Table[0.2 Sin[2 Pi 10 t + 0.8], {t, -1, 2, 1/1000}];

You get

0.800166

Borrowing @belisarius 's

s1 = Table[Sin[x] + RandomReal[1/10], {x, 0, 10 Pi, 1/20}];
s2 = 1/4 Table[Sin[x + 1/2] + RandomReal[1/15], {x, 0, 10 Pi, 1/20}];

Correlation[s1, s2] // ArcCos

0.501371

$\endgroup$
3
  • 1
    $\begingroup$ It's seem the Correlation don't work in this case or I have missed something? $\endgroup$
    – yode
    Commented Apr 14, 2017 at 20:04
  • $\begingroup$ @yode well, this is to estimate the phase difference between 2 harmonic signals and the other question is about aligning 2 general signals, right? $\endgroup$
    – Rojo
    Commented Apr 14, 2017 at 21:12
  • $\begingroup$ Thanks fro explanation,I'm a new commer in signal-processing $\endgroup$
    – yode
    Commented Apr 14, 2017 at 21:17
5
$\begingroup$

Using my function from here and the file you've provided, first import the data and group the first two columns and the last two columns as:

data = convertList /@ Import["/path/to/RLC1.txt", "Data"] /. {} -> Sequence[];
lists = Transpose /@ Partition[Transpose@data, 2];

You can plot them simply as ListPlot[lists]. To find the rows that have the maximum element in the second position, you can choose from Cases or Pick or Select. I like Select, and we can write a function that takes a list and returns those rows that have the maximum value in the second column:

maxList[list_List] := With[{max = Max@list[[;; , 2]]}, Select[list, #[[2]] == max &]];

maxList@First@lists // Short
(* {{-22.8,0.3},{-22.78,0.3},{-22.76,0.3},{-22.74,0.3},{-22.72,0.3},<<128>>,
    {24.24,0.3},{24.26,0.3},{24.28,0.3},{24.34,0.3},{24.36,0.3}} *)

maxList@Last@l // Short
(* {{-22.1,7.4},{-22.08,7.4},{-22.06,7.4},{-22.04,7.4},{-22.02,7.4},<<165>>,
    {24.9,7.4},{24.92,7.4},{24.94,7.4},{24.96,7.4},{24.98,7.4}} *)

You can get the corresponding rows for both lists as maxList /@ lists. With these in hand, you can easily manipulate it however you want. They're both of different lengths, so you'll have to decide how exactly you want to compare the two.

For several files, you can use FileNames to filter the data files, wrap the above commands in a Module and map them across your file list.

$\endgroup$
5
  • $\begingroup$ I'm getting an error when I try to execute the maxList function. It says Syntax::sntxf: ";;" cannot be followed by ",2". Apart from that, this seems to be what I was looking for. $\endgroup$
    – Juan
    Commented Sep 24, 2012 at 20:38
  • $\begingroup$ @Juan I don't get that error... can you try it in a fresh kernel? Perhaps it's due to some earlier definitions... $\endgroup$
    – rm -rf
    Commented Sep 24, 2012 at 20:46
  • $\begingroup$ Still the same error. If I remove the "," from Max@list[[;; , 2]] the line executes without problems. $\endgroup$
    – Juan
    Commented Sep 24, 2012 at 20:54
  • $\begingroup$ Well, then it gets a different part of the expression. Are you using it on your own list or my example above? It relies on the particular structure of the list (I've already separated it into two lists, each with two columns...) $\endgroup$
    – rm -rf
    Commented Sep 24, 2012 at 20:58
  • $\begingroup$ I used @bill s approach, but I like your answer. Actually, I think this will prove useful for another purpose I'll have to deal so thank you. $\endgroup$
    – Juan
    Commented Sep 25, 2012 at 4:28

Your Answer

By clicking “Post Your Answer”, you agree to our terms of service and acknowledge you have read our privacy policy.

Not the answer you're looking for? Browse other questions tagged or ask your own question.